Land Use Right Is Not Depreciable
The legal structure of home ownership in China commonly confers only the land use right and building ownership, without actual land ownership. The two key questions for U.S. tax purposes are:
- Is the land use right depreciable when computing rental income and on the final sale of the property?
- How should the value of the land use right be determined for depreciation allocation?
Depreciability of Land Use Rights
The guiding principle is found in IRC 167(c)(1):
In general. The basis on which exhaustion, wear and tear, and obsolescence are to be allowed in respect of any property shall be the adjusted basis provided in section 1011, for the purpose of determining the gain on the sale or other disposition of such property.
The key requirement is “wear and tear.” IRS Publication 946 clarifies:
To be depreciable, the property must meet all the following requirements.
• It must be property you own.
• It must be used in your business or income-producing activity.
• It must have a determinable useful life.
• It must be expected to last more than 1 year.
More specifically, the IRS states in the same Pub 946:
You cannot depreciate the cost of land because land does not wear out, become obsolete, or get used up.
Lack of ownership is further negative evidence for depreciation eligibility, not positive.
Analogy: U.S. Co-op Apartments
In the U.S., when you buy co-op shares, you obtain a use right (proprietary lease), not actual ownership of real property. While the IRS allows depreciation on the building portion, it explicitly requires exclusion of the land portion. Pub 946 states (page 4):
Subtract from the amount figured in (b) any mortgage debt that is not for the depreciable real property, such as the part for the land.
Conclusion
Land use right - whether arising from foreign law or a U.S. co-op - is not depreciable for U.S. tax purposes.
Allocating Between Land and Building
When the purchase does not specify land vs. building, U.S. practice allows several reasonable methods:
- Appraisal or Tax Assessment: Government or private appraisers may split value. In the U.S., property tax assessments often split land and building. Mortgage appraisals may do this as well.
- Insurance Value: Homeowners’ insurance covers the building only. The insured value gives a reference for the building portion, though it sometimes exceeds actual replacement costs.
- Comparable Sales: Another practical method is to use market data from comparable sales.
- To estimate building value: Find a comparable property in a rural or lower-demand area where land values are minimal and mostly reflect the value of the structure itself. This provides a market-based proxy for what the building alone is worth.
- To estimate land value: Consider what a developer would pay for a property for the purpose of tearing down the existing structure and building anew. The purchase price in this scenario typically reflects land value alone, since the developer is unlikely to place value on a building that will be demolished.
- Rule of Thumb: Use the average land-to-home value ratios as a guideline, keeping in mind that these ratios can vary significantly by location and market type. For detailed data, refer to the appendices.
Summary
While it can be difficult to get an exact allocation, the IRS expects a reasonable approach. For most rental property owners, an estimate based on available local data is sufficient. Ultimately, the accumulated depreciation reduces cost basis on sale - so the allocation largely affects timing of recognized income, not the total gain over the rental’s life.
By the way, the depreciation period for foreign rental is different from the U.S. domestic:
- For foreign residential rental property placed in service after January 1, 2018, use 30 years (ADS).
- For property placed in service before 2018, use 40 years.
- U.S. domestic residential rental property uses a 27.5-year recovery period (GDS).
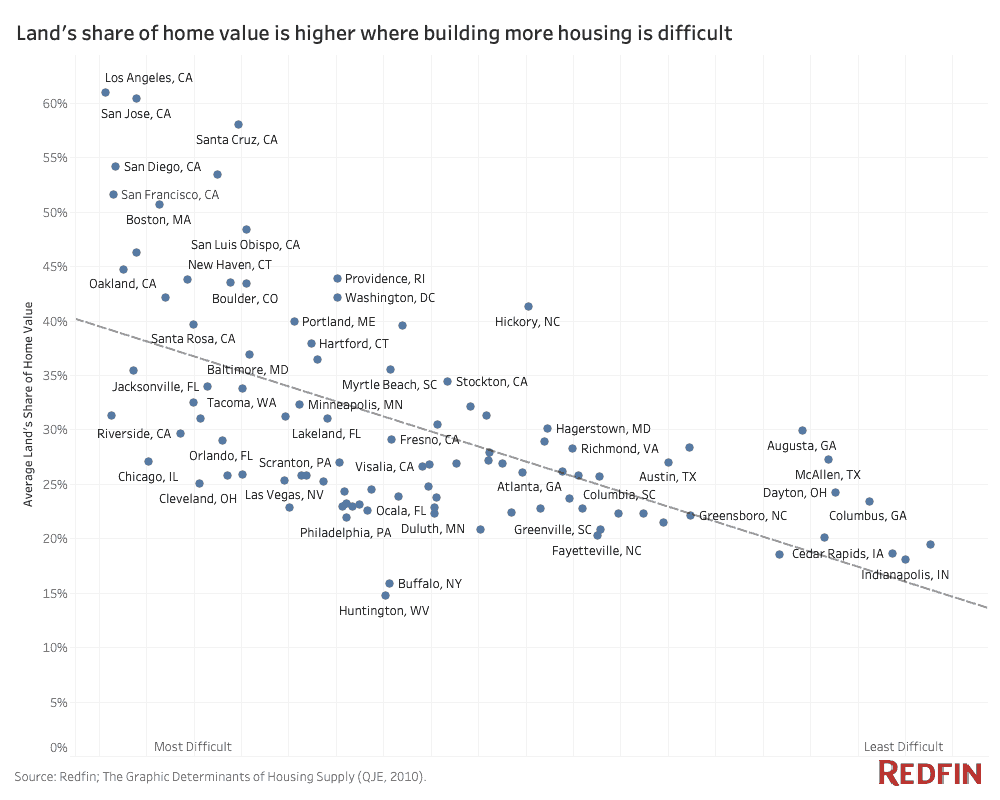
Appendix 1: Typical U.S. Land Share of Home Value
The land’s share of home value varies significantly across the United States, with land being a much higher percentage of total value in expensive urban areas like Los Angeles and a much lower percentage in rural or less expensive areas.
The following diagram from redfin (updated on October 6th, 2020) provides a visual impression:
Here are the more comprehensive data (June 2022) across 1,054 U.S. counties publihed by Federal Housing:
| State | County | FIPS | Year | Land Value (1/4 Acre Lot, Std.) |
Land Value (Per Acre, As-Is) |
Land Share of Property Value |
Property Value (Std.) | Property Value (As-is) |
|---|---|---|---|---|---|---|---|---|
| Alabama | Autauga | 1001 | 2022 | 33,100 | 60,000 | 0.166 | 217,400 | 208,300 |
| Alabama | Baldwin | 1003 | 2022 | 87,200 | 204,200 | 0.280 | 379,200 | 367,600 |
| Alabama | Blount | 1009 | 2022 | 22,800 | 26,800 | 0.129 | 248,200 | 192,400 |
| Alabama | Calhoun | 1015 | 2022 | 17,400 | 34,200 | 0.113 | 185,700 | 169,900 |
| Alabama | Cherokee | 1019 | 2022 | 68,600 | 96,600 | 0.251 | 276,300 | 349,200 |
| Alabama | Coffee | 1031 | 2022 | 25,400 | 66,400 | 0.214 | 190,600 | 169,800 |
| Alabama | Colbert | 1033 | 2022 | 26,600 | 67,700 | 0.136 | 216,700 | 266,500 |
| Alabama | Cullman | 1043 | 2022 | 44,900 | 54,000 | 0.165 | 293,100 | 272,300 |
| Alabama | Elmore | 1051 | 2022 | 37,700 | 58,100 | 0.143 | 279,000 | 287,200 |
| Alabama | Etowah | 1055 | 2022 | 18,800 | 36,100 | 0.107 | 191,800 | 218,000 |
| Alabama | Houston | 1069 | 2022 | 22,600 | 46,900 | 0.146 | 190,500 | 183,600 |
| Alabama | Jackson | 1071 | 2022 | 20,900 | 38,400 | 0.137 | 238,800 | 219,100 |
| Alabama | Jefferson | 1073 | 2022 | 55,800 | 156,600 | 0.306 | 254,600 | 197,800 |
| Alabama | Lauderdale | 1077 | 2022 | 28,500 | 51,500 | 0.155 | 244,900 | 208,200 |
| Alabama | Lee | 1081 | 2022 | 39,700 | 62,400 | 0.194 | 265,700 | 270,300 |
| Alabama | Limestone | 1083 | 2022 | 49,100 | 100,500 | 0.152 | 275,900 | 335,200 |
| Alabama | Madison | 1089 | 2022 | 48,200 | 74,500 | 0.200 | 276,900 | 288,600 |
| Alabama | Marshall | 1095 | 2022 | 25,400 | 40,500 | 0.147 | 248,500 | 199,100 |
| Alabama | Mobile | 1097 | 2022 | 36,600 | 70,600 | 0.186 | 243,000 | 232,200 |
| Alabama | Montgomery | 1101 | 2022 | 27,200 | 93,300 | 0.171 | 178,600 | 167,000 |
| Alabama | Morgan | 1103 | 2022 | 34,500 | 73,500 | 0.148 | 253,400 | 253,400 |
| Alabama | Shelby | 1117 | 2022 | 60,000 | 132,500 | 0.181 | 314,600 | 375,400 |
| Alabama | St. Clair | 1115 | 2022 | 38,000 | 56,800 | 0.175 | 268,800 | 238,900 |
| Alabama | Talladega | 1121 | 2022 | 22,800 | 41,700 | 0.153 | 184,600 | 209,000 |
| Alabama | Tallapoosa | 1123 | 2022 | 126,800 | 247,400 | 0.250 | 476,600 | 714,400 |
| Alabama | Tuscaloosa | 1125 | 2022 | 38,200 | 44,800 | 0.181 | 257,800 | 267,600 |
| Alaska | Anchorage Municipality | 2020 | 2022 | 117,500 | 368,600 | 0.286 | 502,600 | 409,100 |
| Alaska | Juneau City and Borough |
2110 | 2022 | 162,100 | 470,400 | 0.310 | 595,300 | 538,200 |
| Alaska | Matanuska-Susitna Borough | 2170 | 2022 | 47,300 | 65,700 | 0.164 | 372,600 | 363,400 |
| Arizona | Cochise | 4003 | 2022 | 32,700 | 77,400 | 0.156 | 275,100 | 220,200 |
| Arizona | Coconino | 4005 | 2022 | 191,000 | 474,200 | 0.295 | 720,500 | 656,700 |
| Arizona | Gila | 4007 | 2022 | 89,300 | 249,800 | 0.243 | 471,200 | 406,000 |
| Arizona | Graham | 4009 | 2022 | 34,500 | 76,500 | 0.145 | 280,500 | 259,900 |
| Arizona | Maricopa | 4013 | 2022 | 205,000 | 815,500 | 0.324 | 598,100 | 599,100 |
| Arizona | Mohave | 4015 | 2022 | 78,800 | 226,800 | 0.266 | 455,700 | 302,600 |
| Arizona | Navajo | 4017 | 2022 | 73,100 | 165,200 | 0.216 | 428,200 | 381,400 |
| Arizona | Pima | 4019 | 2022 | 114,100 | 379,600 | 0.271 | 429,500 | 407,800 |
| Arizona | Pinal | 4021 | 2022 | 107,500 | 389,000 | 0.259 | 420,200 | 389,300 |
| Arizona | Santa Cruz | 4023 | 2022 | 42,700 | 89,100 | 0.172 | 297,300 | 259,200 |
| Arizona | Yavapai | 4025 | 2022 | 94,400 | 227,700 | 0.213 | 554,700 | 478,100 |
| Arizona | Yuma | 4027 | 2022 | 77,300 | 312,500 | 0.279 | 364,400 | 255,000 |
| Arkansas | Benton | 5007 | 2022 | 54,800 | 145,100 | 0.208 | 353,800 | 301,700 |
| Arkansas | Cleburne | 5023 | 2022 | 42,200 | 51,800 | 0.207 | 285,900 | 262,700 |
| Arkansas | Craighead | 5031 | 2022 | 36,200 | 60,400 | 0.185 | 234,000 | 219,400 |
| Arkansas | Crawford | 5033 | 2022 | 23,900 | 28,000 | 0.161 | 214,100 | 175,700 |
| Arkansas | Crittenden | 5035 | 2022 | 23,900 | 75,700 | 0.179 | 185,500 | 139,600 |
| Arkansas | Faulkner | 5045 | 2022 | 33,900 | 42,300 | 0.179 | 248,100 | 211,500 |
| Arkansas | Garland | 5051 | 2022 | 44,300 | 87,700 | 0.258 | 268,000 | 258,800 |
| Arkansas | Lonoke | 5085 | 2022 | 25,500 | 34,400 | 0.169 | 212,500 | 174,300 |
| Arkansas | Pope | 5115 | 2022 | 17,300 | 20,000 | 0.124 | 206,900 | 169,800 |
| Arkansas | Pulaski | 5119 | 2022 | 39,400 | 128,000 | 0.204 | 231,900 | 200,000 |
| Arkansas | Saline | 5125 | 2022 | 30,900 | 44,500 | 0.208 | 235,700 | 197,200 |
| Arkansas | Sebastian | 5131 | 2022 | 29,200 | 75,400 | 0.153 | 210,800 | 223,200 |
| Arkansas | Washington | 5143 | 2022 | 64,200 | 107,900 | 0.278 | 336,800 | 287,900 |
| Arkansas | White | 5145 | 2022 | 21,400 | 35,700 | 0.118 | 194,900 | 202,500 |
| California | Alameda | 6001 | 2022 | 862,700 | 4,801,300 | 0.519 | 1,638,000 | 1,422,400 |
| California | Amador | 6005 | 2022 | 125,700 | 189,100 | 0.288 | 495,000 | 456,200 |
| California | Butte | 6007 | 2022 | 76,200 | 201,000 | 0.179 | 496,600 | 441,400 |
| California | Calaveras | 6009 | 2022 | 103,700 | 220,100 | 0.228 | 551,800 | 504,800 |
| California | Contra Costa | 6013 | 2022 | 571,600 | 2,547,300 | 0.486 | 1,209,300 | 1,098,900 |
| California | El Dorado | 6017 | 2022 | 216,200 | 525,100 | 0.280 | 801,700 | 807,200 |
| California | Fresno | 6019 | 2022 | 121,300 | 489,200 | 0.276 | 472,400 | 406,000 |
| California | Humboldt | 6023 | 2022 | 157,100 | 504,400 | 0.323 | 552,800 | 481,600 |
| California | Imperial | 6025 | 2022 | 68,800 | 263,800 | 0.204 | 408,600 | 334,200 |
| California | Kern | 6029 | 2022 | 83,300 | 293,800 | 0.240 | 421,800 | 331,700 |
| California | Kings | 6031 | 2022 | 93,200 | 359,000 | 0.282 | 395,800 | 312,700 |
| California | Lake | 6033 | 2022 | 66,500 | 161,400 | 0.225 | 468,200 | 444,700 |
| California | Los Angeles | 6037 | 2022 | 918,300 | 4,134,000 | 0.667 | 1,333,900 | 1,253,300 |
| California | Madera | 6039 | 2022 | 100,700 | 230,500 | 0.263 | 442,900 | 401,500 |
| California | Marin | 6041 | 2022 | 1,102,500 | 3,926,100 | 0.526 | 2,024,800 | 1,967,600 |
| California | Merced | 6047 | 2022 | 97,500 | 313,300 | 0.270 | 479,500 | 362,800 |
| California | Monterey | 6053 | 2022 | 613,800 | 2,270,000 | 0.577 | 1,258,200 | 1,024,600 |
| California | Napa | 6055 | 2022 | 419,700 | 1,493,400 | 0.362 | 1,228,700 | 1,107,000 |
| California | Nevada | 6057 | 2022 | 184,900 | 386,900 | 0.243 | 833,500 | 814,900 |
| California | Orange | 6059 | 2022 | 1,105,700 | 5,411,400 | 0.703 | 1,488,000 | 1,310,900 |
| California | Placer | 6061 | 2022 | 292,100 | 825,900 | 0.339 | 812,000 | 890,800 |
| California | Plumas | 6063 | 2022 | 62,300 | 159,800 | 0.167 | 526,200 | 439,300 |
| California | Riverside | 6065 | 2022 | 273,700 | 1,096,000 | 0.437 | 685,900 | 579,100 |
| California | Sacramento | 6067 | 2022 | 232,000 | 1,022,600 | 0.352 | 683,900 | 586,500 |
| California | San Benito | 6069 | 2022 | 389,900 | 1,460,900 | 0.460 | 863,300 | 802,200 |
| California | San Bernardino | 6071 | 2022 | 295,100 | 1,013,200 | 0.537 | 652,000 | 521,900 |
| California | San Diego | 6073 | 2022 | 765,700 | 2,503,500 | 0.611 | 1,283,300 | 1,212,700 |
| California | San Francisco | 6075 | 2022 | 2,701,300 | 24,324,800 | 0.697 | 2,787,200 | 2,249,400 |
| California | San Joaquin | 6077 | 2022 | 232,300 | 1,068,000 | 0.363 | 630,300 | 566,300 |
| California | San Luis Obispo | 6079 | 2022 | 397,000 | 1,284,400 | 0.398 | 1,064,300 | 924,600 |
| California | San Mateo | 6081 | 2022 | 1,608,400 | 7,909,100 | 0.711 | 2,426,600 | 2,050,400 |
| California | Santa Barbara | 6083 | 2022 | 588,700 | 2,253,600 | 0.431 | 1,415,000 | 1,396,900 |
| California | Santa Clara | 6085 | 2022 | 1,559,200 | 7,643,900 | 0.687 | 2,270,600 | 2,005,900 |
| California | Santa Cruz | 6087 | 2022 | 874,400 | 2,983,300 | 0.588 | 1,592,300 | 1,368,100 |
| California | Shasta | 6089 | 2022 | 71,900 | 175,300 | 0.235 | 459,300 | 326,200 |
| California | Solano | 6095 | 2022 | 216,400 | 1,142,900 | 0.299 | 735,700 | 638,500 |
| California | Sonoma | 6097 | 2022 | 315,500 | 1,039,000 | 0.330 | 1,033,200 | 924,700 |
| California | Stanislaus | 6099 | 2022 | 166,800 | 745,300 | 0.298 | 574,600 | 481,700 |
| California | Sutter | 6101 | 2022 | 92,500 | 344,100 | 0.199 | 508,700 | 451,600 |
| California | Tehama | 6103 | 2022 | 49,000 | 112,900 | 0.157 | 409,700 | 339,800 |
| California | Tulare | 6107 | 2022 | 97,900 | 330,400 | 0.267 | 415,200 | 362,600 |
| California | Tuolumne | 6109 | 2022 | 59,300 | 100,600 | 0.163 | 497,500 | 457,200 |
| California | Ventura | 6111 | 2022 | 542,400 | 2,288,800 | 0.505 | 1,072,500 | 986,300 |
| California | Yolo | 6113 | 2022 | 319,500 | 1,527,700 | 0.437 | 783,300 | 653,800 |
| California | Yuba | 6115 | 2022 | 92,700 | 304,700 | 0.230 | 472,600 | 396,900 |
| Colorado | Adams | 8001 | 2022 | 161,100 | 739,300 | 0.314 | 636,100 | 470,900 |
| Colorado | Arapahoe | 8005 | 2022 | 228,900 | 1,057,300 | 0.380 | 746,700 | 541,200 |
| Colorado | Boulder | 8013 | 2022 | 481,600 | 1,645,600 | 0.535 | 1,091,600 | 844,500 |
| Colorado | Denver | 8031 | 2022 | 454,600 | 2,329,400 | 0.517 | 1,040,800 | 666,100 |
| Colorado | Douglas | 8035 | 2022 | 209,300 | 806,400 | 0.287 | 770,600 | 662,000 |
| Colorado | Eagle | 8037 | 2022 | 545,700 | 1,597,100 | 0.345 | 1,510,400 | 1,557,400 |
| Colorado | El Paso | 8041 | 2022 | 110,300 | 449,200 | 0.238 | 586,300 | 432,900 |
| Colorado | Garfield | 8045 | 2022 | 147,700 | 516,900 | 0.209 | 766,100 | 666,600 |
| Colorado | Grand | 8049 | 2022 | 249,000 | 731,900 | 0.202 | 1,022,100 | 1,115,200 |
| Colorado | Jefferson | 8059 | 2022 | 252,200 | 860,200 | 0.394 | 800,400 | 617,500 |
| Colorado | Larimer | 8069 | 2022 | 187,200 | 608,600 | 0.343 | 680,300 | 536,200 |
| Colorado | Mesa | 8077 | 2022 | 97,300 | 317,200 | 0.239 | 468,700 | 434,500 |
| Colorado | Montrose | 8085 | 2022 | 62,500 | 150,100 | 0.154 | 450,400 | 431,100 |
| Colorado | Park | 8093 | 2022 | 103,200 | 137,300 | 0.264 | 558,800 | 543,500 |
| Colorado | Pueblo | 8101 | 2022 | 39,200 | 115,200 | 0.146 | 403,400 | 271,500 |
| Colorado | Summit | 8117 | 2022 | 409,100 | 1,034,600 | 0.236 | 1,460,500 | 1,736,000 |
| Colorado | Weld | 8123 | 2022 | 120,300 | 433,300 | 0.277 | 551,700 | 411,900 |
| Connecticut | Fairfield | 9001 | 2022 | 318,900 | 643,300 | 0.535 | 723,200 | 661,600 |
| Connecticut | Hartford | 9003 | 2022 | 78,000 | 189,600 | 0.319 | 370,400 | 286,700 |
| Connecticut | Litchfield | 9005 | 2022 | 83,600 | 134,200 | 0.327 | 382,300 | 278,900 |
| Connecticut | Middlesex | 9007 | 2022 | 128,400 | 205,100 | 0.432 | 464,600 | 306,200 |
| Connecticut | New Haven | 9009 | 2022 | 114,600 | 269,500 | 0.376 | 418,000 | 316,600 |
| Connecticut | New London | 9011 | 2022 | 99,900 | 178,500 | 0.351 | 442,100 | 293,400 |
| Connecticut | Tolland | 9013 | 2022 | 65,500 | 91,600 | 0.291 | 347,200 | 262,900 |
| Connecticut | Windham | 9015 | 2022 | 53,000 | 74,600 | 0.220 | 315,200 | 257,800 |
| Delaware | Kent | 10001 | 2022 | 64,000 | 153,200 | 0.244 | 303,400 | 272,100 |
| Delaware | New Castle | 10003 | 2022 | 82,200 | 291,200 | 0.210 | 387,500 | 375,100 |
| Delaware | Sussex | 10005 | 2022 | 211,800 | 441,400 | 0.377 | 523,400 | 568,800 |
| District of Columbia | District of Columbia | 11001 | 2022 | 663,900 | 6,548,600 | 0.560 | 1,226,400 | 885,700 |
| Florida | Alachua | 12001 | 2022 | 87,900 | 196,700 | 0.340 | 372,500 | 290,400 |
| Florida | Bay | 12005 | 2022 | 106,000 | 282,400 | 0.347 | 440,600 | 291,400 |
| Florida | Brevard | 12009 | 2022 | 98,000 | 331,300 | 0.293 | 451,400 | 322,500 |
| Florida | Broward | 12011 | 2022 | 289,000 | 1,293,700 | 0.398 | 689,600 | 617,600 |
| Florida | Charlotte | 12015 | 2022 | 83,200 | 300,400 | 0.246 | 517,700 | 336,000 |
| Florida | Citrus | 12017 | 2022 | 30,600 | 66,700 | 0.142 | 353,500 | 243,100 |
| Florida | Clay | 12019 | 2022 | 67,600 | 147,600 | 0.275 | 355,400 | 277,400 |
| Florida | Collier | 12021 | 2022 | 441,300 | 1,423,100 | 0.343 | 886,700 | 1,325,000 |
| Florida | Duval | 12031 | 2022 | 96,500 | 335,300 | 0.264 | 398,700 | 356,400 |
| Florida | Escambia | 12033 | 2022 | 64,100 | 185,000 | 0.264 | 346,300 | 250,700 |
| Florida | Flagler | 12035 | 2022 | 83,300 | 278,000 | 0.252 | 419,700 | 336,300 |
| Florida | Hernando | 12053 | 2022 | 41,000 | 120,100 | 0.135 | 354,800 | 311,300 |
| Florida | Highlands | 12055 | 2022 | 23,400 | 81,800 | 0.123 | 312,400 | 216,600 |
| Florida | Hillsborough | 12057 | 2022 | 153,800 | 510,200 | 0.392 | 491,200 | 376,500 |
| Florida | Indian River | 12061 | 2022 | 151,700 | 587,000 | 0.307 | 533,500 | 578,700 |
| Florida | Lake | 12069 | 2022 | 59,400 | 153,500 | 0.254 | 356,200 | 268,300 |
| Florida | Lee | 12071 | 2022 | 139,000 | 517,200 | 0.338 | 568,300 | 401,800 |
| Florida | Leon | 12073 | 2022 | 57,300 | 150,300 | 0.256 | 331,400 | 247,700 |
| Florida | Manatee | 12081 | 2022 | 177,700 | 652,700 | 0.392 | 576,500 | 438,200 |
| Florida | Marion | 12083 | 2022 | 36,900 | 95,300 | 0.182 | 331,500 | 213,200 |
| Florida | Martin | 12085 | 2022 | 253,400 | 931,600 | 0.450 | 630,500 | 591,700 |
| Florida | Miami-Dade | 12086 | 2022 | 382,400 | 1,724,100 | 0.507 | 762,600 | 647,700 |
| Florida | Monroe | 12087 | 2022 | 733,700 | 3,089,900 | 0.443 | 1,692,500 | 1,408,400 |
| Florida | Nassau | 12089 | 2022 | 172,600 | 291,300 | 0.409 | 565,600 | 450,200 |
| Florida | Okaloosa | 12091 | 2022 | 121,700 | 359,000 | 0.379 | 449,000 | 330,100 |
| Florida | Orange | 12095 | 2022 | 138,400 | 377,500 | 0.292 | 480,400 | 507,300 |
| Florida | Osceola | 12097 | 2022 | 85,400 | 331,600 | 0.235 | 420,000 | 331,400 |
| Florida | Palm Beach | 12099 | 2022 | 323,700 | 1,125,600 | 0.484 | 700,500 | 634,600 |
| Florida | Pasco | 12101 | 2022 | 81,100 | 281,700 | 0.295 | 409,000 | 257,200 |
| Florida | Pinellas | 12103 | 2022 | 261,600 | 1,133,200 | 0.550 | 646,800 | 406,100 |
| Florida | Polk | 12105 | 2022 | 53,400 | 166,300 | 0.209 | 353,700 | 260,300 |
| Florida | Santa Rosa | 12113 | 2022 | 73,500 | 158,300 | 0.279 | 383,900 | 287,800 |
| Florida | Sarasota | 12115 | 2022 | 174,100 | 683,100 | 0.414 | 596,500 | 423,900 |
| Florida | Seminole | 12117 | 2022 | 107,100 | 376,700 | 0.300 | 454,900 | 350,300 |
| Florida | St. Johns | 12109 | 2022 | 197,700 | 587,000 | 0.404 | 571,300 | 523,100 |
| Florida | St. Lucie | 12111 | 2022 | 97,900 | 358,600 | 0.278 | 415,100 | 323,900 |
| Florida | Sumter | 12119 | 2022 | 187,900 | 640,200 | 0.348 | 579,600 | 408,500 |
| Florida | Volusia | 12127 | 2022 | 76,400 | 251,300 | 0.252 | 412,600 | 310,000 |
| Florida | Walton | 12131 | 2022 | 335,800 | 680,900 | 0.462 | 842,200 | 686,600 |
| Georgia | Baldwin | 13009 | 2022 | 41,300 | 106,800 | 0.277 | 229,600 | 279,300 |
| Georgia | Barrow | 13013 | 2022 | 45,200 | 68,500 | 0.157 | 334,600 | 313,000 |
| Georgia | Bartow | 13015 | 2022 | 43,400 | 78,400 | 0.160 | 327,400 | 294,000 |
| Georgia | Bibb | 13021 | 2022 | 18,600 | 49,200 | 0.145 | 188,500 | 161,000 |
| Georgia | Bryan | 13029 | 2022 | 57,100 | 130,300 | 0.192 | 312,800 | 361,600 |
| Georgia | Bulloch | 13031 | 2022 | 22,600 | 40,200 | 0.122 | 217,200 | 242,600 |
| Georgia | Camden | 13039 | 2022 | 29,600 | 72,200 | 0.142 | 293,400 | 269,200 |
| Georgia | Carroll | 13045 | 2022 | 36,600 | 57,000 | 0.162 | 304,500 | 251,700 |
| Georgia | Catoosa | 13047 | 2022 | 32,400 | 59,100 | 0.119 | 309,400 | 275,100 |
| Georgia | Chatham | 13051 | 2022 | 83,000 | 290,800 | 0.224 | 393,100 | 352,500 |
| Georgia | Cherokee | 13057 | 2022 | 86,400 | 182,100 | 0.240 | 397,000 | 378,300 |
| Georgia | Clarke | 13059 | 2022 | 66,900 | 137,200 | 0.218 | 389,800 | 323,000 |
| Georgia | Clayton | 13063 | 2022 | 42,400 | 76,900 | 0.180 | 264,800 | 266,800 |
| Georgia | Cobb | 13067 | 2022 | 113,300 | 314,700 | 0.306 | 409,700 | 391,700 |
| Georgia | Columbia | 13073 | 2022 | 52,900 | 121,300 | 0.185 | 261,600 | 319,400 |
| Georgia | Coweta | 13077 | 2022 | 55,100 | 74,500 | 0.217 | 318,100 | 293,100 |
| Georgia | Dawson | 13085 | 2022 | 83,900 | 127,900 | 0.223 | 486,700 | 428,600 |
| Georgia | DeKalb | 13089 | 2022 | 128,300 | 386,600 | 0.329 | 410,000 | 398,500 |
| Georgia | Douglas | 13097 | 2022 | 54,000 | 106,500 | 0.206 | 311,000 | 279,500 |
| Georgia | Effingham | 13103 | 2022 | 42,200 | 71,700 | 0.160 | 275,800 | 295,300 |
| Georgia | Fannin | 13111 | 2022 | 89,700 | 77,200 | 0.160 | 680,400 | 542,300 |
| Georgia | Fayette | 13113 | 2022 | 74,800 | 89,300 | 0.174 | 354,200 | 486,400 |
| Georgia | Floyd | 13115 | 2022 | 24,500 | 50,500 | 0.129 | 256,800 | 219,800 |
| Georgia | Forsyth | 13117 | 2022 | 107,600 | 225,200 | 0.200 | 455,600 | 571,000 |
| Georgia | Fulton | 13121 | 2022 | 159,900 | 448,200 | 0.283 | 472,200 | 578,000 |
| Georgia | Gilmer | 13123 | 2022 | 31,400 | 47,800 | 0.116 | 458,800 | 425,000 |
| Georgia | Glynn | 13127 | 2022 | 124,800 | 342,200 | 0.309 | 407,900 | 447,300 |
| Georgia | Gordon | 13129 | 2022 | 23,200 | 34,700 | 0.105 | 276,700 | 240,700 |
| Georgia | Greene | 13133 | 2022 | 144,100 | 294,000 | 0.347 | 495,100 | 625,400 |
| Georgia | Gwinnett | 13135 | 2022 | 68,900 | 183,700 | 0.198 | 363,200 | 364,700 |
| Georgia | Hall | 13139 | 2022 | 59,900 | 111,100 | 0.187 | 382,600 | 387,300 |
| Georgia | Haralson | 13143 | 2022 | 27,000 | 32,400 | 0.121 | 263,000 | 236,200 |
| Georgia | Harris | 13145 | 2022 | 40,900 | 45,400 | 0.170 | 261,700 | 276,300 |
| Georgia | Hart | 13147 | 2022 | 136,700 | 124,900 | 0.282 | 420,400 | 372,600 |
| Georgia | Henry | 13151 | 2022 | 50,700 | 139,700 | 0.203 | 286,000 | 249,900 |
| Georgia | Houston | 13153 | 2022 | 27,300 | 70,500 | 0.144 | 207,900 | 217,800 |
| Georgia | Jackson | 13157 | 2022 | 43,000 | 55,600 | 0.140 | 314,800 | 328,900 |
| Georgia | Liberty | 13179 | 2022 | 32,100 | 54,300 | 0.140 | 240,500 | 264,900 |
| Georgia | Lowndes | 13185 | 2022 | 25,900 | 62,400 | 0.142 | 218,800 | 205,900 |
| Georgia | Lumpkin | 13187 | 2022 | 47,700 | 44,600 | 0.147 | 411,900 | 335,200 |
| Georgia | Monroe | 13207 | 2022 | 25,300 | 35,700 | 0.129 | 226,200 | 272,500 |
| Georgia | Muscogee | 13215 | 2022 | 33,100 | 102,500 | 0.198 | 205,100 | 190,800 |
| Georgia | Newton | 13217 | 2022 | 40,300 | 63,700 | 0.159 | 281,300 | 269,500 |
| Georgia | Oconee | 13219 | 2022 | 67,700 | 88,100 | 0.183 | 379,800 | 429,200 |
| Georgia | Paulding | 13223 | 2022 | 54,400 | 96,400 | 0.205 | 332,400 | 276,200 |
| Georgia | Pickens | 13227 | 2022 | 42,600 | 52,800 | 0.159 | 388,000 | 321,700 |
| Georgia | Putnam | 13237 | 2022 | 200,400 | 247,800 | 0.395 | 529,300 | 549,900 |
| Georgia | Richmond | 13245 | 2022 | 34,300 | 104,600 | 0.183 | 231,500 | 197,300 |
| Georgia | Rockdale | 13247 | 2022 | 44,500 | 83,700 | 0.167 | 279,300 | 298,200 |
| Georgia | Spalding | 13255 | 2022 | 33,300 | 50,700 | 0.148 | 266,700 | 213,800 |
| Georgia | Thomas | 13275 | 2022 | 25,600 | 56,300 | 0.134 | 247,500 | 234,100 |
| Georgia | Troup | 13285 | 2022 | 27,400 | 46,800 | 0.153 | 217,300 | 211,200 |
| Georgia | Union | 13291 | 2022 | 80,100 | 62,400 | 0.193 | 515,600 | 348,600 |
| Georgia | Walker | 13295 | 2022 | 23,800 | 31,300 | 0.122 | 271,900 | 206,600 |
| Georgia | Walton | 13297 | 2022 | 43,000 | 60,800 | 0.142 | 306,600 | 346,000 |
| Georgia | White | 13311 | 2022 | 38,700 | 38,400 | 0.162 | 321,900 | 279,800 |
| Georgia | Whitfield | 13313 | 2022 | 26,000 | 47,400 | 0.127 | 270,200 | 239,400 |
| Hawaii | Hawaii | 15001 | 2022 | 210,700 | 489,300 | 0.317 | 808,900 | 726,000 |
| Hawaii | Honolulu | 15003 | 2022 | 994,500 | 4,952,600 | 0.696 | 1,473,300 | 1,272,500 |
| Hawaii | Maui | 15009 | 2022 | 500,800 | 1,707,500 | 0.419 | 1,301,500 | 1,180,500 |
| Idaho | Ada | 16001 | 2022 | 232,500 | 853,400 | 0.402 | 653,800 | 552,900 |
| Idaho | Bannock | 16005 | 2022 | 64,900 | 169,600 | 0.252 | 435,500 | 322,900 |
| Idaho | Bingham | 16011 | 2022 | 50,800 | 97,000 | 0.158 | 387,900 | 379,400 |
| Idaho | Bonner | 16017 | 2022 | 225,400 | 499,500 | 0.303 | 778,500 | 856,300 |
| Idaho | Bonneville | 16019 | 2022 | 63,700 | 184,900 | 0.184 | 483,600 | 368,100 |
| Idaho | Canyon | 16027 | 2022 | 128,100 | 379,600 | 0.333 | 480,000 | 396,500 |
| Idaho | Jefferson | 16051 | 2022 | 58,800 | 99,000 | 0.153 | 423,600 | 485,800 |
| Idaho | Kootenai | 16055 | 2022 | 226,100 | 738,100 | 0.312 | 756,800 | 769,900 |
| Idaho | Latah | 16057 | 2022 | 95,900 | 304,100 | 0.211 | 486,300 | 451,300 |
| Idaho | Madison | 16065 | 2022 | 57,400 | 118,200 | 0.134 | 439,000 | 458,500 |
| Idaho | Nez Perce | 16069 | 2022 | 57,000 | 208,000 | 0.163 | 453,200 | 351,000 |
| Idaho | Teton | 16081 | 2022 | 129,700 | 283,400 | 0.149 | 894,200 | 984,000 |
| Idaho | Twin Falls | 16083 | 2022 | 75,400 | 204,900 | 0.199 | 429,100 | 399,300 |
| Illinois | Adams | 17001 | 2022 | 18,300 | 50,100 | 0.091 | 211,000 | 205,300 |
| Illinois | Champaign | 17019 | 2022 | 41,700 | 98,000 | 0.260 | 247,900 | 217,300 |
| Illinois | Clinton | 17027 | 2022 | 23,200 | 58,500 | 0.157 | 207,300 | 171,300 |
| Illinois | Cook | 17031 | 2022 | 162,800 | 754,100 | 0.325 | 462,200 | 392,100 |
| Illinois | DeKalb | 17037 | 2022 | 35,400 | 115,100 | 0.144 | 262,100 | 250,600 |
| Illinois | DuPage | 17043 | 2022 | 166,300 | 599,900 | 0.405 | 474,200 | 410,900 |
| Illinois | Effingham | 17049 | 2022 | 26,100 | 68,700 | 0.137 | 222,600 | 232,800 |
| Illinois | Grundy | 17063 | 2022 | 48,400 | 152,300 | 0.181 | 283,700 | 279,100 |
| Illinois | Kane | 17089 | 2022 | 75,300 | 248,300 | 0.207 | 351,600 | 364,200 |
| Illinois | Kankakee | 17091 | 2022 | 27,700 | 93,800 | 0.135 | 233,100 | 213,800 |
| Illinois | Kendall | 17093 | 2022 | 63,100 | 226,000 | 0.174 | 324,100 | 345,200 |
| Illinois | Lake | 17097 | 2022 | 97,700 | 313,100 | 0.359 | 377,500 | 295,500 |
| Illinois | LaSalle | 17099 | 2022 | 45,700 | 112,000 | 0.239 | 228,700 | 204,400 |
| Illinois | Macon | 17115 | 2022 | 20,500 | 59,500 | 0.155 | 176,200 | 148,800 |
| Illinois | Madison | 17119 | 2022 | 25,800 | 78,300 | 0.143 | 229,400 | 200,000 |
| Illinois | McHenry | 17111 | 2022 | 60,800 | 181,300 | 0.237 | 329,800 | 271,200 |
| Illinois | McLean | 17113 | 2022 | 50,500 | 157,800 | 0.254 | 253,500 | 223,000 |
| Illinois | Monroe | 17133 | 2022 | 38,300 | 107,400 | 0.167 | 281,900 | 262,600 |
| Illinois | Peoria | 17143 | 2022 | 24,700 | 54,400 | 0.193 | 231,600 | 168,400 |
| Illinois | Rock Island | 17161 | 2022 | 36,900 | 116,400 | 0.265 | 222,600 | 145,700 |
| Illinois | Sangamon | 17167 | 2022 | 24,700 | 88,100 | 0.125 | 225,800 | 222,700 |
| Illinois | St. Clair | 17163 | 2022 | 29,100 | 69,400 | 0.175 | 220,200 | 217,100 |
| Illinois | Tazewell | 17179 | 2022 | 18,200 | 56,000 | 0.160 | 214,700 | 125,000 |
| Illinois | Will | 17197 | 2022 | 75,400 | 178,600 | 0.232 | 340,800 | 361,000 |
| Illinois | Williamson | 17199 | 2022 | 18,400 | 43,200 | 0.119 | 176,700 | 175,000 |
| Illinois | Winnebago | 17201 | 2022 | 26,200 | 83,500 | 0.167 | 210,700 | 179,800 |
| Indiana | Allen | 18003 | 2022 | 33,300 | 107,300 | 0.191 | 255,100 | 185,400 |
| Indiana | Bartholomew | 18005 | 2022 | 39,700 | 121,200 | 0.216 | 286,800 | 217,400 |
| Indiana | Boone | 18011 | 2022 | 67,400 | 164,500 | 0.237 | 335,800 | 328,200 |
| Indiana | Clark | 18019 | 2022 | 39,000 | 102,300 | 0.196 | 295,000 | 208,300 |
| Indiana | Dearborn | 18029 | 2022 | 32,800 | 57,500 | 0.195 | 272,400 | 206,500 |
| Indiana | Delaware | 18035 | 2022 | 18,600 | 58,000 | 0.172 | 182,100 | 122,100 |
| Indiana | Elkhart | 18039 | 2022 | 31,600 | 85,700 | 0.214 | 265,600 | 168,700 |
| Indiana | Floyd | 18043 | 2022 | 39,700 | 93,600 | 0.206 | 304,800 | 214,300 |
| Indiana | Hamilton | 18057 | 2022 | 86,700 | 274,100 | 0.239 | 362,700 | 395,000 |
| Indiana | Hancock | 18059 | 2022 | 41,900 | 90,500 | 0.183 | 261,000 | 258,200 |
| Indiana | Harrison | 18061 | 2022 | 29,500 | 36,600 | 0.178 | 243,900 | 204,700 |
| Indiana | Hendricks | 18063 | 2022 | 42,700 | 105,200 | 0.167 | 289,800 | 281,300 |
| Indiana | Howard | 18067 | 2022 | 15,900 | 48,400 | 0.121 | 199,100 | 146,600 |
| Indiana | Jasper | 18073 | 2022 | 29,200 | 55,000 | 0.162 | 244,100 | 215,400 |
| Indiana | Johnson | 18081 | 2022 | 42,100 | 131,100 | 0.172 | 299,600 | 268,700 |
| Indiana | Kosciusko | 18085 | 2022 | 92,000 | 199,300 | 0.379 | 349,400 | 243,100 |
| Indiana | Lake | 18089 | 2022 | 38,300 | 154,900 | 0.199 | 291,000 | 189,700 |
| Indiana | LaPorte | 18091 | 2022 | 50,800 | 114,600 | 0.287 | 307,300 | 183,900 |
| Indiana | Madison | 18095 | 2022 | 21,400 | 62,900 | 0.155 | 196,300 | 145,800 |
| Indiana | Marion | 18097 | 2022 | 41,700 | 154,100 | 0.195 | 299,100 | 207,900 |
| Indiana | Marshall | 18099 | 2022 | 51,800 | 100,900 | 0.280 | 268,700 | 200,300 |
| Indiana | Monroe | 18105 | 2022 | 63,500 | 143,300 | 0.228 | 380,500 | 288,700 |
| Indiana | Morgan | 18109 | 2022 | 30,200 | 61,600 | 0.139 | 258,900 | 258,600 |
| Indiana | Porter | 18127 | 2022 | 53,300 | 125,300 | 0.237 | 349,200 | 251,700 |
| Indiana | Putnam | 18133 | 2022 | 32,300 | 64,100 | 0.192 | 254,700 | 184,600 |
| Indiana | Shelby | 18145 | 2022 | 26,000 | 61,000 | 0.158 | 230,500 | 184,500 |
| Indiana | St. Joseph | 18141 | 2022 | 29,700 | 99,800 | 0.211 | 272,200 | 155,000 |
| Indiana | Steuben | 18151 | 2022 | 118,900 | 217,000 | 0.397 | 401,600 | 267,400 |
| Indiana | Tippecanoe | 18157 | 2022 | 47,400 | 149,000 | 0.210 | 294,400 | 230,700 |
| Indiana | Vanderburgh | 18163 | 2022 | 23,200 | 77,300 | 0.149 | 235,100 | 161,900 |
| Indiana | Vigo | 18167 | 2022 | 16,300 | 44,600 | 0.144 | 191,500 | 129,800 |
| Indiana | Warrick | 18173 | 2022 | 30,700 | 84,400 | 0.154 | 259,400 | 238,200 |
| Iowa | Black Hawk | 19013 | 2022 | 42,500 | 153,900 | 0.252 | 253,900 | 172,600 |
| Iowa | Dallas | 19049 | 2022 | 73,400 | 230,200 | 0.256 | 353,300 | 305,600 |
| Iowa | Dickinson | 19059 | 2022 | 218,500 | 627,900 | 0.329 | 572,200 | 661,800 |
| Iowa | Dubuque | 19061 | 2022 | 39,500 | 118,200 | 0.222 | 296,300 | 185,600 |
| Iowa | Jasper | 19099 | 2022 | 24,200 | 65,700 | 0.127 | 256,900 | 211,900 |
| Iowa | Johnson | 19103 | 2022 | 78,200 | 259,200 | 0.220 | 380,600 | 379,000 |
| Iowa | Linn | 19113 | 2022 | 47,000 | 131,100 | 0.219 | 298,100 | 264,800 |
| Iowa | Polk | 19153 | 2022 | 56,300 | 198,800 | 0.267 | 338,700 | 216,100 |
| Iowa | Pottawattamie | 19155 | 2022 | 37,600 | 129,200 | 0.189 | 284,000 | 201,800 |
| Iowa | Scott | 19163 | 2022 | 51,800 | 177,700 | 0.316 | 286,300 | 167,500 |
| Iowa | Story | 19169 | 2022 | 62,100 | 206,800 | 0.299 | 329,100 | 214,200 |
| Iowa | Warren | 19181 | 2022 | 60,600 | 181,600 | 0.199 | 325,900 | 323,500 |
| Iowa | Webster | 19187 | 2022 | 18,600 | 60,600 | 0.172 | 199,100 | 112,100 |
| Iowa | Woodbury | 19193 | 2022 | 29,700 | 110,900 | 0.155 | 263,300 | 184,100 |
| Kansas | Butler | 20015 | 2022 | 22,400 | 66,100 | 0.138 | 265,900 | 179,500 |
| Kansas | Douglas | 20045 | 2022 | 60,300 | 217,300 | 0.242 | 366,800 | 242,900 |
| Kansas | Ellis | 20051 | 2022 | 26,700 | 97,600 | 0.117 | 277,100 | 241,000 |
| Kansas | Finney | 20055 | 2022 | 26,300 | 96,400 | 0.101 | 330,700 | 257,500 |
| Kansas | Ford | 20057 | 2022 | 16,300 | 48,900 | 0.077 | 284,400 | 216,600 |
| Kansas | Johnson | 20091 | 2022 | 93,500 | 329,800 | 0.308 | 419,600 | 318,200 |
| Kansas | Leavenworth | 20103 | 2022 | 31,400 | 91,600 | 0.177 | 277,400 | 192,900 |
| Kansas | Miami | 20121 | 2022 | 36,100 | 124,200 | 0.141 | 289,600 | 254,300 |
| Kansas | Reno | 20155 | 2022 | 13,100 | 40,500 | 0.114 | 192,500 | 124,000 |
| Kansas | Riley | 20161 | 2022 | 32,300 | 55,000 | 0.174 | 299,700 | 261,900 |
| Kansas | Sedgwick | 20173 | 2022 | 24,500 | 92,800 | 0.159 | 276,400 | 155,700 |
| Kansas | Shawnee | 20177 | 2022 | 18,300 | 62,700 | 0.123 | 240,900 | 158,600 |
| Kansas | Wyandotte | 20209 | 2022 | 28,000 | 99,400 | 0.178 | 265,100 | 154,900 |
| Kentucky | Barren | 21009 | 2022 | 18,800 | 35,900 | 0.099 | 226,200 | 231,200 |
| Kentucky | Boone | 21015 | 2022 | 48,400 | 122,000 | 0.230 | 322,900 | 237,900 |
| Kentucky | Bullitt | 21029 | 2022 | 38,200 | 83,100 | 0.177 | 316,500 | 242,600 |
| Kentucky | Campbell | 21037 | 2022 | 45,400 | 137,400 | 0.151 | 345,100 | 297,500 |
| Kentucky | Clark | 21049 | 2022 | 31,000 | 98,700 | 0.137 | 251,600 | 232,200 |
| Kentucky | Daviess | 21059 | 2022 | 29,400 | 88,600 | 0.165 | 253,100 | 190,100 |
| Kentucky | Fayette | 21067 | 2022 | 70,300 | 291,800 | 0.233 | 365,700 | 280,500 |
| Kentucky | Franklin | 21073 | 2022 | 32,000 | 92,900 | 0.143 | 267,900 | 234,900 |
| Kentucky | Hardin | 21093 | 2022 | 30,700 | 62,600 | 0.161 | 285,000 | 212,000 |
| Kentucky | Hopkins | 21107 | 2022 | 13,800 | 31,000 | 0.098 | 197,600 | 184,500 |
| Kentucky | Jefferson | 21111 | 2022 | 53,300 | 205,400 | 0.171 | 349,200 | 309,600 |
| Kentucky | Jessamine | 21113 | 2022 | 56,700 | 132,100 | 0.249 | 309,000 | 486,300 |
| Kentucky | Kenton | 21117 | 2022 | 44,300 | 132,100 | 0.187 | 324,300 | 257,200 |
| Kentucky | Laurel | 21125 | 2022 | 17,900 | 31,900 | 0.098 | 239,000 | 224,600 |
| Kentucky | Madison | 21151 | 2022 | 31,700 | 60,300 | 0.122 | 267,400 | 283,300 |
| Kentucky | Nelson | 21179 | 2022 | 35,200 | 78,500 | 0.158 | 303,500 | 251,300 |
| Kentucky | Oldham | 21185 | 2022 | 76,000 | 135,100 | 0.187 | 371,400 | 485,800 |
| Kentucky | Pulaski | 21199 | 2022 | 16,900 | 24,100 | 0.105 | 232,100 | 204,800 |
| Kentucky | Scott | 21209 | 2022 | 47,200 | 152,600 | 0.152 | 303,700 | 309,300 |
| Kentucky | Shelby | 21211 | 2022 | 37,400 | 92,500 | 0.132 | 304,600 | 297,600 |
| Kentucky | Spencer | 21215 | 2022 | 40,200 | 50,200 | 0.139 | 322,100 | 351,300 |
| Kentucky | Warren | 21227 | 2022 | 42,200 | 83,700 | 0.185 | 280,200 | 240,800 |
| Kentucky | Woodford | 21239 | 2022 | 43,300 | 135,800 | 0.161 | 293,800 | 289,800 |
| Louisiana | Acadia Parish | 22001 | 2022 | 23,500 | 47,700 | 0.146 | 184,700 | 192,600 |
| Louisiana | Ascension Parish | 22005 | 2022 | 59,300 | 154,700 | 0.193 | 295,900 | 329,400 |
| Louisiana | Assumption Parish | 22007 | 2022 | 40,100 | 95,800 | 0.195 | 228,900 | 258,300 |
| Louisiana | Bossier Parish | 22015 | 2022 | 36,400 | 116,800 | 0.139 | 242,800 | 242,400 |
| Louisiana | Caddo Parish | 22017 | 2022 | 33,900 | 58,100 | 0.192 | 217,300 | 239,200 |
| Louisiana | Calcasieu Parish | 22019 | 2022 | 38,800 | 92,100 | 0.156 | 225,600 | 274,600 |
| Louisiana | East Baton Rouge Parish | 22033 | 2022 | 76,000 | 163,400 | 0.267 | 286,800 | 357,900 |
| Louisiana | Iberia Parish | 22045 | 2022 | 24,700 | 57,200 | 0.142 | 198,800 | 213,100 |
| Louisiana | Jefferson Parish | 22051 | 2022 | 155,600 | 648,000 | 0.314 | 351,200 | 353,900 |
| Louisiana | Lafayette Parish | 22055 | 2022 | 51,800 | 175,000 | 0.171 | 272,100 | 303,300 |
| Louisiana | Lafourche Parish | 22057 | 2022 | 39,300 | 117,100 | 0.176 | 247,800 | 254,300 |
| Louisiana | Lincoln Parish | 22061 | 2022 | 34,700 | 57,100 | 0.133 | 244,900 | 298,700 |
| Louisiana | Livingston Parish | 22063 | 2022 | 42,600 | 93,500 | 0.167 | 267,900 | 279,900 |
| Louisiana | Natchitoches Parish | 22069 | 2022 | 31,400 | 56,400 | 0.179 | 219,800 | 241,500 |
| Louisiana | Orleans Parish | 22071 | 2022 | 268,400 | 1,078,400 | 0.319 | 450,500 | 468,500 |
| Louisiana | Ouachita Parish | 22073 | 2022 | 33,700 | 46,100 | 0.190 | 217,800 | 255,100 |
| Louisiana | Plaquemines Parish | 22075 | 2022 | 83,000 | 242,200 | 0.195 | 343,100 | 455,000 |
| Louisiana | Rapides Parish | 22079 | 2022 | 28,300 | 41,300 | 0.161 | 210,500 | 241,800 |
| Louisiana | St. Bernard Parish | 22087 | 2022 | 58,400 | 250,700 | 0.173 | 262,600 | 264,800 |
| Louisiana | St. Charles Parish | 22089 | 2022 | 78,000 | 301,500 | 0.247 | 295,600 | 316,300 |
| Louisiana | St. James Parish | 22093 | 2022 | 41,000 | 113,100 | 0.192 | 232,500 | 281,300 |
| Louisiana | St. John the Baptist Parish | 22095 | 2022 | 45,500 | 179,200 | 0.178 | 250,500 | 236,200 |
| Louisiana | St. Landry Parish | 22097 | 2022 | 22,600 | 44,100 | 0.131 | 186,000 | 209,500 |
| Louisiana | St. Martin Parish | 22099 | 2022 | 29,200 | 57,200 | 0.150 | 212,500 | 236,800 |
| Louisiana | St. Mary Parish | 22101 | 2022 | 34,900 | 108,800 | 0.185 | 208,700 | 198,000 |
| Louisiana | St. Tammany Parish | 22103 | 2022 | 46,100 | 79,900 | 0.184 | 278,200 | 344,900 |
| Louisiana | Tangipahoa Parish | 22105 | 2022 | 30,200 | 51,500 | 0.174 | 239,500 | 207,400 |
| Louisiana | Terrebonne Parish | 22109 | 2022 | 43,100 | 122,200 | 0.218 | 239,900 | 245,400 |
| Louisiana | Vermilion Parish | 22113 | 2022 | 22,500 | 39,000 | 0.132 | 190,400 | 218,700 |
| Louisiana | Washington Parish | 22117 | 2022 | 14,200 | 18,900 | 0.097 | 163,600 | 180,400 |
| Louisiana | West Baton Rouge Parish | 22121 | 2022 | 45,400 | 111,700 | 0.182 | 257,800 | 279,000 |
| Maine | Androscoggin | 23001 | 2022 | 33,700 | 58,800 | 0.137 | 307,300 | 279,900 |
| Maine | Cumberland | 23005 | 2022 | 147,200 | 253,000 | 0.285 | 648,200 | 516,200 |
| Maine | Hancock | 23009 | 2022 | 135,600 | 178,900 | 0.308 | 533,100 | 453,600 |
| Maine | Kennebec | 23011 | 2022 | 35,900 | 62,800 | 0.167 | 292,800 | 219,200 |
| Maine | Oxford | 23017 | 2022 | 54,900 | 62,700 | 0.167 | 325,100 | 332,500 |
| Maine | Penobscot | 23019 | 2022 | 29,000 | 59,400 | 0.126 | 272,100 | 260,300 |
| Maine | York | 23031 | 2022 | 239,500 | 379,600 | 0.502 | 650,800 | 450,600 |
| Maryland | Anne Arundel | 24003 | 2022 | 231,200 | 717,000 | 0.440 | 578,300 | 515,700 |
| Maryland | Baltimore City | 24510 | 2022 | 131,400 | 897,200 | 0.287 | 396,200 | 243,600 |
| Maryland | Baltimore | 24005 | 2022 | 124,800 | 435,400 | 0.332 | 435,700 | 355,400 |
| Maryland | Calvert | 24009 | 2022 | 126,600 | 215,400 | 0.328 | 454,000 | 433,000 |
| Maryland | Caroline | 24011 | 2022 | 53,100 | 97,600 | 0.251 | 272,100 | 268,700 |
| Maryland | Carroll | 24013 | 2022 | 127,300 | 230,800 | 0.348 | 434,800 | 410,400 |
| Maryland | Cecil | 24015 | 2022 | 69,800 | 138,800 | 0.252 | 334,300 | 318,200 |
| Maryland | Charles | 24017 | 2022 | 123,600 | 318,300 | 0.309 | 418,200 | 397,400 |
| Maryland | Dorchester | 24019 | 2022 | 52,600 | 121,500 | 0.269 | 269,400 | 261,100 |
| Maryland | Frederick | 24021 | 2022 | 131,400 | 326,100 | 0.293 | 481,700 | 446,000 |
| Maryland | Garrett | 24023 | 2022 | 130,100 | 163,800 | 0.286 | 517,000 | 464,800 |
| Maryland | Harford | 24025 | 2022 | 111,500 | 290,700 | 0.307 | 409,100 | 369,400 |
| Maryland | Howard | 24027 | 2022 | 233,500 | 624,000 | 0.402 | 591,800 | 587,200 |
| Maryland | Kent | 24029 | 2022 | 82,800 | 166,600 | 0.311 | 341,900 | 321,300 |
| Maryland | Montgomery | 24031 | 2022 | 369,600 | 1,372,500 | 0.483 | 777,900 | 724,100 |
| Maryland | Prince George’s | 24033 | 2022 | 132,700 | 522,500 | 0.291 | 490,900 | 442,500 |
| Maryland | Queen Anne’s | 24035 | 2022 | 150,500 | 281,200 | 0.393 | 426,400 | 441,600 |
| Maryland | St. Mary’s | 24037 | 2022 | 107,200 | 180,600 | 0.323 | 380,600 | 375,600 |
| Maryland | Talbot | 24041 | 2022 | 134,400 | 308,800 | 0.352 | 446,000 | 432,400 |
| Maryland | Washington | 24043 | 2022 | 60,900 | 148,800 | 0.233 | 307,100 | 283,100 |
| Maryland | Wicomico | 24045 | 2022 | 36,100 | 83,300 | 0.177 | 268,400 | 243,700 |
| Maryland | Worcester | 24047 | 2022 | 188,300 | 509,800 | 0.419 | 483,300 | 428,100 |
| Massachusetts | Barnstable | 25001 | 2022 | 313,100 | 661,300 | 0.481 | 934,600 | 688,800 |
| Massachusetts | Berkshire | 25003 | 2022 | 70,100 | 153,900 | 0.242 | 369,600 | 323,100 |
| Massachusetts | Bristol | 25005 | 2022 | 157,400 | 363,400 | 0.396 | 511,100 | 422,000 |
| Massachusetts | Essex | 25009 | 2022 | 287,100 | 778,300 | 0.479 | 734,000 | 610,600 |
| Massachusetts | Hampden | 25013 | 2022 | 71,700 | 197,400 | 0.271 | 349,500 | 281,000 |
| Massachusetts | Hampshire | 25015 | 2022 | 114,000 | 196,900 | 0.331 | 458,800 | 366,600 |
| Massachusetts | Middlesex | 25017 | 2022 | 484,300 | 1,204,400 | 0.606 | 942,700 | 786,800 |
| Massachusetts | Norfolk | 25021 | 2022 | 404,900 | 994,600 | 0.565 | 852,800 | 743,000 |
| Massachusetts | Plymouth | 25023 | 2022 | 254,900 | 475,400 | 0.472 | 663,500 | 564,600 |
| Massachusetts | Suffolk | 25025 | 2022 | 596,900 | 4,481,600 | 0.570 | 1,098,600 | 798,000 |
| Massachusetts | Worcester | 25027 | 2022 | 120,000 | 240,000 | 0.350 | 469,700 | 365,400 |
| Michigan | Allegan | 26005 | 2022 | 74,100 | 114,700 | 0.223 | 381,900 | 351,600 |
| Michigan | Alpena | 26007 | 2022 | 15,200 | 43,500 | 0.116 | 202,200 | 164,100 |
| Michigan | Barry | 26015 | 2022 | 74,500 | 110,900 | 0.279 | 352,600 | 248,900 |
| Michigan | Bay | 26017 | 2022 | 6,700 | 30,500 | 0.046 | 189,700 | 126,100 |
| Michigan | Berrien | 26021 | 2022 | 69,900 | 160,600 | 0.215 | 361,500 | 365,200 |
| Michigan | Calhoun | 26025 | 2022 | 25,900 | 87,600 | 0.218 | 240,400 | 121,000 |
| Michigan | Cass | 26027 | 2022 | 152,600 | 204,000 | 0.325 | 418,200 | 382,300 |
| Michigan | Clinton | 26037 | 2022 | 46,400 | 78,600 | 0.184 | 290,400 | 277,600 |
| Michigan | Eaton | 26045 | 2022 | 36,000 | 101,400 | 0.206 | 283,400 | 182,000 |
| Michigan | Genesee | 26049 | 2022 | 17,500 | 75,500 | 0.198 | 163,000 | 87,400 |
| Michigan | Grand Traverse | 26055 | 2022 | 116,600 | 203,000 | 0.247 | 587,100 | 510,700 |
| Michigan | Ingham | 26065 | 2022 | 32,500 | 123,400 | 0.241 | 270,000 | 137,600 |
| Michigan | Ionia | 26067 | 2022 | 35,700 | 55,300 | 0.164 | 244,400 | 219,500 |
| Michigan | Jackson | 26075 | 2022 | 32,000 | 60,900 | 0.137 | 274,300 | 231,300 |
| Michigan | Kalamazoo | 26077 | 2022 | 56,900 | 147,500 | 0.209 | 336,500 | 288,800 |
| Michigan | Kent | 26081 | 2022 | 44,000 | 195,600 | 0.195 | 370,800 | 217,100 |
| Michigan | Lapeer | 26087 | 2022 | 34,100 | 50,200 | 0.169 | 281,600 | 219,700 |
| Michigan | Leelanau | 26089 | 2022 | 246,300 | 410,400 | 0.314 | 814,300 | 945,600 |
| Michigan | Lenawee | 26091 | 2022 | 54,600 | 93,000 | 0.266 | 284,600 | 218,300 |
| Michigan | Livingston | 26093 | 2022 | 95,800 | 154,600 | 0.344 | 414,600 | 292,600 |
| Michigan | Macomb | 26099 | 2022 | 60,800 | 249,600 | 0.265 | 328,000 | 226,100 |
| Michigan | Marquette | 26103 | 2022 | 25,700 | 58,200 | 0.123 | 277,700 | 254,100 |
| Michigan | Midland | 26111 | 2022 | 35,200 | 67,600 | 0.154 | 281,000 | 253,300 |
| Michigan | Monroe | 26115 | 2022 | 26,700 | 112,500 | 0.167 | 264,800 | 156,500 |
| Michigan | Montcalm | 26117 | 2022 | 69,700 | 105,100 | 0.274 | 269,900 | 231,800 |
| Michigan | Muskegon | 26121 | 2022 | 33,200 | 88,400 | 0.170 | 286,600 | 230,700 |
| Michigan | Oakland | 26125 | 2022 | 113,800 | 315,500 | 0.312 | 409,200 | 394,400 |
| Michigan | Ottawa | 26139 | 2022 | 61,000 | 201,100 | 0.240 | 409,400 | 262,200 |
| Michigan | Saginaw | 26145 | 2022 | 14,700 | 40,700 | 0.161 | 191,000 | 107,800 |
| Michigan | Shiawassee | 26155 | 2022 | 19,300 | 41,700 | 0.129 | 222,100 | 180,400 |
| Michigan | St. Clair | 26147 | 2022 | 49,200 | 92,100 | 0.250 | 284,800 | 231,900 |
| Michigan | St. Joseph | 26149 | 2022 | 57,400 | 99,800 | 0.229 | 282,900 | 238,400 |
| Michigan | Van Buren | 26159 | 2022 | 69,000 | 109,400 | 0.209 | 345,400 | 310,100 |
| Michigan | Washtenaw | 26161 | 2022 | 155,200 | 495,700 | 0.389 | 572,200 | 392,400 |
| Michigan | Wayne | 26163 | 2022 | 41,900 | 226,100 | 0.216 | 257,400 | 175,300 |
| Minnesota | Anoka | 27003 | 2022 | 89,100 | 243,400 | 0.257 | 429,100 | 382,800 |
| Minnesota | Becker | 27005 | 2022 | 177,900 | 345,300 | 0.383 | 478,100 | 517,600 |
| Minnesota | Carver | 27019 | 2022 | 142,800 | 325,700 | 0.416 | 481,300 | 429,600 |
| Minnesota | Cass | 27021 | 2022 | 240,100 | 290,700 | 0.415 | 593,600 | 650,100 |
| Minnesota | Chisago | 27025 | 2022 | 86,200 | 161,700 | 0.304 | 385,700 | 327,800 |
| Minnesota | Clay | 27027 | 2022 | 43,300 | 146,000 | 0.148 | 328,300 | 295,500 |
| Minnesota | Crow Wing | 27035 | 2022 | 90,200 | 164,100 | 0.298 | 433,200 | 430,500 |
| Minnesota | Dakota | 27037 | 2022 | 104,700 | 344,400 | 0.245 | 464,400 | 440,300 |
| Minnesota | Douglas | 27041 | 2022 | 83,300 | 169,100 | 0.325 | 392,300 | 341,100 |
| Minnesota | Hennepin | 27053 | 2022 | 167,000 | 582,300 | 0.442 | 569,700 | 378,500 |
| Minnesota | Kandiyohi | 27067 | 2022 | 43,600 | 102,500 | 0.173 | 323,500 | 295,200 |
| Minnesota | McLeod | 27085 | 2022 | 30,500 | 90,100 | 0.128 | 278,800 | 254,000 |
| Minnesota | Olmsted | 27109 | 2022 | 74,400 | 265,400 | 0.282 | 428,200 | 259,200 |
| Minnesota | Otter Tail | 27111 | 2022 | 104,900 | 242,300 | 0.390 | 366,900 | 379,900 |
| Minnesota | Polk | 27119 | 2022 | 22,100 | 58,800 | 0.084 | 287,800 | 273,000 |
| Minnesota | Ramsey | 27123 | 2022 | 123,500 | 474,300 | 0.312 | 496,700 | 362,500 |
| Minnesota | Rice | 27131 | 2022 | 57,200 | 171,200 | 0.234 | 347,700 | 264,400 |
| Minnesota | Scott | 27139 | 2022 | 131,400 | 454,800 | 0.327 | 453,200 | 375,400 |
| Minnesota | Sherburne | 27141 | 2022 | 65,700 | 160,800 | 0.267 | 396,700 | 278,500 |
| Minnesota | St. Louis | 27137 | 2022 | 30,600 | 62,800 | 0.199 | 301,800 | 279,700 |
| Minnesota | Stearns | 27145 | 2022 | 47,800 | 112,500 | 0.207 | 321,000 | 302,700 |
| Minnesota | Washington | 27163 | 2022 | 123,700 | 350,500 | 0.306 | 473,800 | 440,400 |
| Minnesota | Wright | 27171 | 2022 | 72,500 | 169,200 | 0.244 | 402,400 | 384,400 |
| Mississippi | DeSoto | 28033 | 2022 | 43,800 | 97,000 | 0.228 | 264,900 | 207,900 |
| Mississippi | Forrest | 28035 | 2022 | 19,200 | 26,400 | 0.140 | 209,400 | 184,100 |
| Mississippi | Hancock | 28045 | 2022 | 42,900 | 116,800 | 0.152 | 285,900 | 308,700 |
| Mississippi | Harrison | 28047 | 2022 | 36,000 | 88,500 | 0.207 | 244,300 | 196,000 |
| Mississippi | Hinds | 28049 | 2022 | 18,700 | 58,700 | 0.151 | 159,000 | 142,400 |
| Mississippi | Jackson | 28059 | 2022 | 26,200 | 71,500 | 0.162 | 212,000 | 203,600 |
| Mississippi | Lafayette | 28071 | 2022 | 81,200 | 165,400 | 0.326 | 355,000 | 278,700 |
| Mississippi | Lamar | 28073 | 2022 | 30,400 | 50,200 | 0.181 | 238,100 | 233,400 |
| Mississippi | Lauderdale | 28075 | 2022 | 15,100 | 29,700 | 0.155 | 146,700 | 112,900 |
| Mississippi | Lee | 28081 | 2022 | 25,600 | 29,400 | 0.188 | 220,200 | 159,200 |
| Mississippi | Lowndes | 28087 | 2022 | 15,100 | 29,800 | 0.111 | 189,600 | 171,600 |
| Mississippi | Madison | 28089 | 2022 | 51,100 | 86,800 | 0.209 | 258,000 | 365,000 |
| Mississippi | Pearl River | 28109 | 2022 | 16,600 | 23,900 | 0.111 | 203,400 | 183,000 |
| Mississippi | Rankin | 28121 | 2022 | 35,800 | 47,200 | 0.198 | 249,000 | 220,000 |
| Missouri | Barry | 29009 | 2022 | 18,900 | 43,400 | 0.086 | 241,500 | 237,300 |
| Missouri | Boone | 29019 | 2022 | 49,600 | 152,400 | 0.171 | 321,200 | 320,300 |
| Missouri | Buchanan | 29021 | 2022 | 25,500 | 76,000 | 0.143 | 223,800 | 189,100 |
| Missouri | Camden | 29029 | 2022 | 126,800 | 295,200 | 0.233 | 580,100 | 570,900 |
| Missouri | Cape Girardeau | 29031 | 2022 | 29,900 | 80,500 | 0.137 | 256,100 | 248,800 |
| Missouri | Cass | 29037 | 2022 | 48,100 | 147,900 | 0.229 | 332,300 | 228,300 |
| Missouri | Christian | 29043 | 2022 | 37,100 | 109,000 | 0.124 | 306,800 | 308,400 |
| Missouri | Clay | 29047 | 2022 | 48,600 | 165,900 | 0.230 | 334,000 | 213,700 |
| Missouri | Cole | 29051 | 2022 | 28,900 | 73,700 | 0.185 | 251,900 | 183,100 |
| Missouri | Franklin | 29071 | 2022 | 30,600 | 66,600 | 0.148 | 259,800 | 231,100 |
| Missouri | Greene | 29077 | 2022 | 31,800 | 105,800 | 0.139 | 284,200 | 244,200 |
| Missouri | Howell | 29091 | 2022 | 14,600 | 27,000 | 0.094 | 212,800 | 175,300 |
| Missouri | Jackson | 29095 | 2022 | 42,900 | 166,000 | 0.163 | 302,100 | 253,800 |
| Missouri | Jasper | 29097 | 2022 | 16,400 | 47,900 | 0.092 | 206,100 | 193,000 |
| Missouri | Jefferson | 29099 | 2022 | 37,300 | 80,100 | 0.192 | 293,300 | 204,300 |
| Missouri | Laclede | 29105 | 2022 | 15,900 | 34,700 | 0.093 | 229,800 | 196,700 |
| Missouri | Lincoln | 29113 | 2022 | 28,800 | 63,700 | 0.184 | 267,200 | 178,400 |
| Missouri | Morgan | 29141 | 2022 | 87,000 | 210,500 | 0.219 | 426,400 | 394,100 |
| Missouri | Newton | 29145 | 2022 | 16,000 | 29,500 | 0.087 | 218,500 | 213,900 |
| Missouri | Perry | 29157 | 2022 | 20,600 | 41,000 | 0.143 | 190,600 | 169,000 |
| Missouri | Pettis | 29159 | 2022 | 13,300 | 50,900 | 0.096 | 210,000 | 143,000 |
| Missouri | Platte | 29165 | 2022 | 59,800 | 175,300 | 0.257 | 365,300 | 258,200 |
| Missouri | Polk | 29167 | 2022 | 19,900 | 47,200 | 0.104 | 218,600 | 202,200 |
| Missouri | Scott | 29201 | 2022 | 18,100 | 45,300 | 0.118 | 187,400 | 174,400 |
| Missouri | St. Charles | 29183 | 2022 | 63,100 | 221,400 | 0.180 | 360,300 | 356,400 |
| Missouri | St. Francois | 29187 | 2022 | 20,000 | 47,700 | 0.123 | 209,600 | 173,800 |
| Missouri | St. Louis City | 29510 | 2022 | 49,300 | 315,500 | 0.144 | 276,300 | 245,700 |
| Missouri | St. Louis | 29189 | 2022 | 83,800 | 323,100 | 0.274 | 349,900 | 321,000 |
| Missouri | Ste. Genevieve | 29186 | 2022 | 19,800 | 48,000 | 0.112 | 241,400 | 229,200 |
| Missouri | Stone | 29209 | 2022 | 55,900 | 107,100 | 0.150 | 396,800 | 427,500 |
| Missouri | Taney | 29213 | 2022 | 31,800 | 77,600 | 0.118 | 312,500 | 302,800 |
| Missouri | Warren | 29219 | 2022 | 35,900 | 115,500 | 0.167 | 302,900 | 291,800 |
| Montana | Cascade | 30013 | 2022 | 46,200 | 161,700 | 0.191 | 391,200 | 239,700 |
| Montana | Flathead | 30029 | 2022 | 182,500 | 392,300 | 0.323 | 756,400 | 635,600 |
| Montana | Gallatin | 30031 | 2022 | 283,000 | 694,500 | 0.376 | 874,700 | 830,700 |
| Montana | Lewis and Clark | 30049 | 2022 | 99,800 | 208,900 | 0.229 | 505,400 | 454,800 |
| Montana | Missoula | 30063 | 2022 | 166,100 | 424,900 | 0.326 | 700,900 | 522,900 |
| Montana | Park | 30067 | 2022 | 121,300 | 256,400 | 0.322 | 489,500 | 433,000 |
| Montana | Ravalli | 30081 | 2022 | 109,600 | 163,800 | 0.248 | 512,300 | 528,300 |
| Montana | Silver Bow | 30093 | 2022 | 54,700 | 220,700 | 0.159 | 404,700 | 289,900 |
| Montana | Yellowstone | 30111 | 2022 | 61,300 | 187,800 | 0.193 | 479,000 | 324,600 |
| Nebraska | Adams | 31001 | 2022 | 26,600 | 100,100 | 0.134 | 272,100 | 194,800 |
| Nebraska | Buffalo | 31019 | 2022 | 44,900 | 131,100 | 0.161 | 310,300 | 285,200 |
| Nebraska | Cass | 31025 | 2022 | 38,000 | 113,400 | 0.195 | 291,100 | 209,100 |
| Nebraska | Douglas | 31055 | 2022 | 47,800 | 200,000 | 0.220 | 355,900 | 205,400 |
| Nebraska | Hall | 31079 | 2022 | 30,400 | 108,600 | 0.181 | 307,200 | 177,300 |
| Nebraska | Lancaster | 31109 | 2022 | 59,800 | 257,000 | 0.241 | 374,400 | 221,100 |
| Nebraska | Madison | 31119 | 2022 | 28,100 | 99,400 | 0.128 | 269,000 | 223,000 |
| Nebraska | Sarpy | 31153 | 2022 | 49,200 | 188,100 | 0.212 | 344,600 | 228,200 |
| Nebraska | Washington | 31177 | 2022 | 30,000 | 81,800 | 0.153 | 294,000 | 224,600 |
| Nevada | Carson City | 32510 | 2022 | 136,500 | 426,400 | 0.281 | 583,800 | 477,800 |
| Nevada | Clark | 32003 | 2022 | 152,100 | 701,300 | 0.262 | 566,700 | 436,500 |
| Nevada | Douglas | 32005 | 2022 | 293,900 | 675,700 | 0.394 | 884,500 | 797,200 |
| Nevada | Elko | 32007 | 2022 | 66,200 | 122,300 | 0.231 | 367,600 | 294,300 |
| Nevada | Lyon | 32019 | 2022 | 80,300 | 205,000 | 0.218 | 438,900 | 380,300 |
| Nevada | Nye | 32023 | 2022 | 43,300 | 72,900 | 0.181 | 359,600 | 305,100 |
| Nevada | Washoe | 32031 | 2022 | 202,500 | 677,900 | 0.332 | 705,200 | 618,100 |
| New Hampshire | Belknap | 33001 | 2022 | 215,900 | 307,700 | 0.442 | 669,800 | 463,800 |
| New Hampshire | Carroll | 33003 | 2022 | 232,500 | 302,100 | 0.474 | 674,700 | 502,500 |
| New Hampshire | Cheshire | 33005 | 2022 | 55,000 | 67,000 | 0.257 | 344,600 | 216,500 |
| New Hampshire | Grafton | 33009 | 2022 | 108,200 | 150,300 | 0.345 | 457,200 | 338,700 |
| New Hampshire | Hillsborough | 33011 | 2022 | 141,900 | 248,100 | 0.433 | 475,500 | 351,500 |
| New Hampshire | Merrimack | 33013 | 2022 | 107,300 | 162,200 | 0.365 | 442,800 | 309,500 |
| New Hampshire | Rockingham | 33015 | 2022 | 221,100 | 280,600 | 0.515 | 616,600 | 434,500 |
| New Hampshire | Strafford | 33017 | 2022 | 112,000 | 180,600 | 0.365 | 443,700 | 322,900 |
| New Jersey | Atlantic | 34001 | 2022 | 206,800 | 580,500 | 0.384 | 464,700 | 464,600 |
| New Jersey | Bergen | 34003 | 2022 | 375,300 | 1,364,600 | 0.474 | 724,600 | 760,400 |
| New Jersey | Burlington | 34005 | 2022 | 113,700 | 344,000 | 0.296 | 388,900 | 391,300 |
| New Jersey | Camden | 34007 | 2022 | 90,200 | 375,100 | 0.274 | 345,100 | 311,000 |
| New Jersey | Cape May | 34009 | 2022 | 665,300 | 2,395,600 | 0.588 | 942,300 | 1,054,000 |
| New Jersey | Cumberland | 34011 | 2022 | 41,600 | 103,100 | 0.199 | 256,400 | 235,900 |
| New Jersey | Essex | 34013 | 2022 | 302,900 | 1,466,600 | 0.415 | 651,100 | 672,900 |
| New Jersey | Gloucester | 34015 | 2022 | 78,800 | 207,000 | 0.243 | 339,800 | 339,100 |
| New Jersey | Hudson | 34017 | 2022 | 504,000 | 4,664,700 | 0.456 | 875,500 | 744,500 |
| New Jersey | Hunterdon | 34019 | 2022 | 164,500 | 219,300 | 0.346 | 478,800 | 521,300 |
| New Jersey | Mercer | 34021 | 2022 | 156,700 | 601,100 | 0.375 | 447,100 | 419,400 |
| New Jersey | Middlesex | 34023 | 2022 | 230,900 | 910,600 | 0.404 | 565,600 | 545,400 |
| New Jersey | Monmouth | 34025 | 2022 | 374,000 | 1,030,200 | 0.484 | 712,300 | 772,800 |
| New Jersey | Morris | 34027 | 2022 | 257,700 | 608,500 | 0.422 | 609,400 | 642,000 |
| New Jersey | Ocean | 34029 | 2022 | 320,900 | 1,177,600 | 0.521 | 646,800 | 573,600 |
| New Jersey | Passaic | 34031 | 2022 | 221,500 | 896,300 | 0.396 | 561,700 | 526,500 |
| New Jersey | Salem | 34033 | 2022 | 48,500 | 109,400 | 0.216 | 256,100 | 244,100 |
| New Jersey | Somerset | 34035 | 2022 | 238,200 | 482,800 | 0.407 | 577,600 | 634,300 |
| New Jersey | Sussex | 34037 | 2022 | 131,900 | 255,200 | 0.348 | 433,300 | 403,400 |
| New Jersey | Union | 34039 | 2022 | 306,000 | 1,379,700 | 0.445 | 653,200 | 639,700 |
| New Jersey | Warren | 34041 | 2022 | 97,000 | 210,800 | 0.297 | 361,300 | 354,700 |
| New Mexico | Bernalillo | 35001 | 2022 | 92,600 | 350,500 | 0.237 | 385,100 | 359,400 |
| New Mexico | Chaves | 35005 | 2022 | 20,500 | 77,500 | 0.126 | 225,400 | 161,600 |
| New Mexico | Doña Ana | 35013 | 2022 | 47,300 | 129,100 | 0.209 | 279,900 | 241,500 |
| New Mexico | Eddy | 35015 | 2022 | 35,400 | 114,800 | 0.143 | 278,800 | 258,400 |
| New Mexico | San Juan | 35045 | 2022 | 40,000 | 92,600 | 0.157 | 278,400 | 271,800 |
| New Mexico | Sandoval | 35043 | 2022 | 72,700 | 198,200 | 0.202 | 349,600 | 377,800 |
| New Mexico | Santa Fe | 35049 | 2022 | 134,200 | 286,200 | 0.207 | 633,700 | 670,700 |
| New Mexico | Taos | 35055 | 2022 | 57,600 | 88,900 | 0.145 | 497,400 | 480,300 |
| New Mexico | Valencia | 35061 | 2022 | 49,200 | 90,100 | 0.240 | 267,500 | 238,800 |
| New York | Albany | 36001 | 2022 | 53,300 | 170,400 | 0.170 | 333,500 | 323,400 |
| New York | Bronx | 36005 | 2022 | 415,400 | 4,118,900 | 0.391 | 953,600 | 738,800 |
| New York | Broome | 36007 | 2022 | 20,300 | 57,600 | 0.119 | 211,200 | 182,400 |
| New York | Clinton | 36019 | 2022 | 37,100 | 63,300 | 0.196 | 229,000 | 215,900 |
| New York | Columbia | 36021 | 2022 | 60,300 | 89,200 | 0.161 | 451,400 | 397,500 |
| New York | Dutchess | 36027 | 2022 | 82,700 | 146,600 | 0.220 | 430,600 | 426,200 |
| New York | Erie | 36029 | 2022 | 46,500 | 162,600 | 0.160 | 315,200 | 289,900 |
| New York | Essex | 36031 | 2022 | 105,100 | 173,900 | 0.362 | 327,900 | 331,500 |
| New York | Greene | 36039 | 2022 | 44,000 | 66,700 | 0.134 | 391,100 | 378,000 |
| New York | Kings | 36047 | 2022 | 2,329,700 | 15,217,700 | 0.473 | 1,987,600 | 1,774,500 |
| New York | Madison | 36053 | 2022 | 44,800 | 75,100 | 0.193 | 249,200 | 232,300 |
| New York | Monroe | 36055 | 2022 | 36,700 | 117,100 | 0.157 | 271,900 | 245,600 |
| New York | Nassau | 36059 | 2022 | 443,200 | 2,091,800 | 0.476 | 888,100 | 833,100 |
| New York | Niagara | 36063 | 2022 | 23,400 | 71,900 | 0.118 | 253,800 | 228,600 |
| New York | Oneida | 36065 | 2022 | 18,100 | 47,500 | 0.097 | 230,800 | 213,700 |
| New York | Onondaga | 36067 | 2022 | 32,100 | 100,300 | 0.148 | 262,000 | 230,100 |
| New York | Ontario | 36069 | 2022 | 64,600 | 125,600 | 0.251 | 293,500 | 286,800 |
| New York | Orange | 36071 | 2022 | 85,300 | 176,800 | 0.232 | 415,600 | 413,600 |
| New York | Oswego | 36075 | 2022 | 20,400 | 36,200 | 0.129 | 194,700 | 183,000 |
| New York | Putnam | 36079 | 2022 | 137,700 | 234,500 | 0.324 | 520,600 | 486,900 |
| New York | Queens | 36081 | 2022 | 710,400 | 5,922,100 | 0.475 | 1,326,600 | 962,000 |
| New York | Rensselaer | 36083 | 2022 | 34,900 | 80,300 | 0.144 | 279,100 | 262,400 |
| New York | Richmond | 36085 | 2022 | 547,300 | 3,561,000 | 0.447 | 1,026,600 | 799,900 |
| New York | Rockland | 36087 | 2022 | 264,900 | 665,300 | 0.416 | 647,300 | 677,500 |
| New York | Saratoga | 36091 | 2022 | 74,100 | 147,400 | 0.202 | 391,500 | 394,200 |
| New York | Schenectady | 36093 | 2022 | 38,800 | 130,100 | 0.160 | 286,600 | 251,600 |
| New York | St. Lawrence | 36089 | 2022 | 19,000 | 39,100 | 0.156 | 150,200 | 156,500 |
| New York | Suffolk | 36103 | 2022 | 492,100 | 1,052,500 | 0.485 | 1,034,500 | 1,175,200 |
| New York | Sullivan | 36105 | 2022 | 42,400 | 71,300 | 0.170 | 298,400 | 274,100 |
| New York | Ulster | 36111 | 2022 | 56,800 | 96,600 | 0.178 | 406,200 | 373,100 |
| New York | Warren | 36113 | 2022 | 82,400 | 165,200 | 0.243 | 401,700 | 367,100 |
| New York | Westchester | 36119 | 2022 | 356,500 | 1,006,000 | 0.401 | 859,200 | 904,800 |
| North Carolina | Alamance | 37001 | 2022 | 37,400 | 74,500 | 0.151 | 297,100 | 268,100 |
| North Carolina | Ashe | 37009 | 2022 | 29,700 | 42,600 | 0.104 | 390,900 | 372,800 |
| North Carolina | Brunswick | 37019 | 2022 | 94,900 | 155,900 | 0.269 | 465,900 | 359,700 |
| North Carolina | Buncombe | 37021 | 2022 | 83,000 | 154,100 | 0.205 | 572,000 | 454,300 |
| North Carolina | Cabarrus | 37025 | 2022 | 59,700 | 139,000 | 0.187 | 356,400 | 340,200 |
| North Carolina | Carteret | 37031 | 2022 | 207,600 | 457,900 | 0.440 | 513,200 | 512,900 |
| North Carolina | Catawba | 37035 | 2022 | 36,900 | 80,900 | 0.173 | 335,800 | 292,800 |
| North Carolina | Chatham | 37037 | 2022 | 101,400 | 159,300 | 0.244 | 406,700 | 483,300 |
| North Carolina | Cherokee | 37039 | 2022 | 28,100 | 29,400 | 0.098 | 384,200 | 311,300 |
| North Carolina | Cleveland | 37045 | 2022 | 20,400 | 37,000 | 0.104 | 281,300 | 255,100 |
| North Carolina | Craven | 37049 | 2022 | 44,100 | 111,100 | 0.228 | 283,000 | 240,200 |
| North Carolina | Cumberland | 37051 | 2022 | 32,700 | 85,000 | 0.179 | 246,000 | 202,600 |
| North Carolina | Currituck | 37053 | 2022 | 111,700 | 195,200 | 0.264 | 440,200 | 523,700 |
| North Carolina | Dare | 37055 | 2022 | 239,800 | 715,000 | 0.355 | 696,000 | 697,700 |
| North Carolina | Davidson | 37057 | 2022 | 36,100 | 56,900 | 0.171 | 278,600 | 228,900 |
| North Carolina | Davie | 37059 | 2022 | 45,600 | 62,200 | 0.167 | 301,900 | 289,000 |
| North Carolina | Durham | 37063 | 2022 | 102,600 | 288,200 | 0.239 | 462,000 | 437,100 |
| North Carolina | Forsyth | 37067 | 2022 | 48,900 | 116,700 | 0.211 | 308,400 | 254,600 |
| North Carolina | Franklin | 37069 | 2022 | 53,300 | 63,700 | 0.192 | 312,600 | 294,700 |
| North Carolina | Gaston | 37071 | 2022 | 42,300 | 95,000 | 0.162 | 330,200 | 295,200 |
| North Carolina | Granville | 37077 | 2022 | 39,800 | 57,700 | 0.156 | 296,600 | 317,000 |
| North Carolina | Guilford | 37081 | 2022 | 54,800 | 137,400 | 0.216 | 307,100 | 271,700 |
| North Carolina | Harnett | 37085 | 2022 | 42,300 | 71,900 | 0.198 | 275,800 | 222,800 |
| North Carolina | Haywood | 37087 | 2022 | 41,800 | 72,600 | 0.169 | 407,700 | 302,900 |
| North Carolina | Henderson | 37089 | 2022 | 55,100 | 93,200 | 0.160 | 459,500 | 394,700 |
| North Carolina | Hoke | 37093 | 2022 | 34,200 | 63,200 | 0.133 | 237,900 | 245,200 |
| North Carolina | Iredell | 37097 | 2022 | 66,700 | 147,900 | 0.237 | 351,100 | 399,200 |
| North Carolina | Jackson | 37099 | 2022 | 44,700 | 61,400 | 0.107 | 538,900 | 543,000 |
| North Carolina | Johnston | 37101 | 2022 | 55,600 | 82,300 | 0.182 | 320,300 | 330,300 |
| North Carolina | Lincoln | 37109 | 2022 | 56,600 | 91,600 | 0.184 | 358,600 | 379,700 |
| North Carolina | Macon | 37113 | 2022 | 32,200 | 45,500 | 0.097 | 505,900 | 424,700 |
| North Carolina | Mecklenburg | 37119 | 2022 | 142,800 | 454,600 | 0.339 | 465,400 | 445,200 |
| North Carolina | Moore | 37125 | 2022 | 58,500 | 95,900 | 0.218 | 348,800 | 358,500 |
| North Carolina | Nash | 37127 | 2022 | 25,800 | 53,800 | 0.134 | 228,600 | 240,400 |
| North Carolina | New Hanover | 37129 | 2022 | 170,000 | 509,800 | 0.365 | 495,700 | 473,500 |
| North Carolina | Onslow | 37133 | 2022 | 58,800 | 123,900 | 0.233 | 311,800 | 266,900 |
| North Carolina | Orange | 37135 | 2022 | 148,700 | 259,600 | 0.471 | 511,600 | 346,100 |
| North Carolina | Pasquotank | 37139 | 2022 | 32,100 | 73,500 | 0.145 | 248,600 | 274,900 |
| North Carolina | Pender | 37141 | 2022 | 130,100 | 214,700 | 0.319 | 451,100 | 443,300 |
| North Carolina | Pitt | 37147 | 2022 | 30,500 | 73,500 | 0.168 | 246,500 | 211,900 |
| North Carolina | Randolph | 37151 | 2022 | 29,000 | 41,900 | 0.150 | 269,700 | 216,200 |
| North Carolina | Rockingham | 37157 | 2022 | 24,300 | 36,000 | 0.165 | 236,900 | 217,400 |
| North Carolina | Rowan | 37159 | 2022 | 30,300 | 59,300 | 0.143 | 294,500 | 281,100 |
| North Carolina | Surry | 37171 | 2022 | 19,400 | 30,000 | 0.101 | 264,100 | 229,800 |
| North Carolina | Transylvania | 37175 | 2022 | 60,700 | 91,100 | 0.141 | 545,300 | 492,700 |
| North Carolina | Union | 37179 | 2022 | 80,900 | 158,100 | 0.223 | 377,500 | 424,300 |
| North Carolina | Wake | 37183 | 2022 | 139,000 | 367,900 | 0.265 | 482,800 | 542,000 |
| North Carolina | Watauga | 37189 | 2022 | 66,300 | 100,700 | 0.150 | 562,400 | 503,000 |
| North Carolina | Wayne | 37191 | 2022 | 27,400 | 57,400 | 0.140 | 224,700 | 250,800 |
| North Carolina | Wilkes | 37193 | 2022 | 16,600 | 29,200 | 0.098 | 252,700 | 248,000 |
| North Carolina | Wilson | 37195 | 2022 | 30,500 | 64,800 | 0.129 | 238,400 | 269,700 |
| North Dakota | Burleigh | 38015 | 2022 | 67,600 | 169,500 | 0.172 | 434,600 | 415,600 |
| North Dakota | Cass | 38017 | 2022 | 70,000 | 280,800 | 0.198 | 413,900 | 328,000 |
| North Dakota | Grand Forks | 38035 | 2022 | 55,400 | 217,200 | 0.164 | 342,100 | 311,500 |
| North Dakota | Morton | 38059 | 2022 | 53,600 | 168,800 | 0.168 | 389,400 | 352,700 |
| North Dakota | Stark | 38089 | 2022 | 49,900 | 176,500 | 0.153 | 358,700 | 330,700 |
| North Dakota | Ward | 38101 | 2022 | 44,400 | 143,300 | 0.158 | 318,800 | 288,100 |
| Ohio | Allen | 39003 | 2022 | 18,800 | 51,300 | 0.142 | 194,600 | 148,200 |
| Ohio | Auglaize | 39011 | 2022 | 26,700 | 62,600 | 0.136 | 228,000 | 205,800 |
| Ohio | Butler | 39017 | 2022 | 46,300 | 138,600 | 0.188 | 290,600 | 267,400 |
| Ohio | Clark | 39023 | 2022 | 22,800 | 61,800 | 0.160 | 209,500 | 162,100 |
| Ohio | Clermont | 39025 | 2022 | 49,100 | 93,300 | 0.187 | 306,900 | 287,800 |
| Ohio | Cuyahoga | 39035 | 2022 | 46,000 | 187,000 | 0.288 | 275,000 | 160,100 |
| Ohio | Delaware | 39041 | 2022 | 97,000 | 223,100 | 0.294 | 387,300 | 393,700 |
| Ohio | Erie | 39043 | 2022 | 36,400 | 94,000 | 0.224 | 264,000 | 172,800 |
| Ohio | Fairfield | 39045 | 2022 | 55,300 | 127,500 | 0.228 | 304,900 | 267,500 |
| Ohio | Franklin | 39049 | 2022 | 79,900 | 330,100 | 0.237 | 391,500 | 317,900 |
| Ohio | Geauga | 39055 | 2022 | 71,800 | 70,300 | 0.266 | 318,300 | 264,100 |
| Ohio | Greene | 39057 | 2022 | 49,300 | 131,900 | 0.214 | 282,900 | 270,700 |
| Ohio | Hamilton | 39061 | 2022 | 63,800 | 213,000 | 0.309 | 341,900 | 208,500 |
| Ohio | Hancock | 39063 | 2022 | 33,700 | 102,000 | 0.207 | 249,200 | 184,900 |
| Ohio | Knox | 39083 | 2022 | 34,000 | 73,900 | 0.220 | 280,700 | 183,100 |
| Ohio | Lake | 39085 | 2022 | 47,900 | 130,100 | 0.224 | 275,400 | 240,200 |
| Ohio | Lawrence | 39087 | 2022 | 22,400 | 51,200 | 0.168 | 207,800 | 145,100 |
| Ohio | Licking | 39089 | 2022 | 52,600 | 112,400 | 0.262 | 297,200 | 215,400 |
| Ohio | Lorain | 39093 | 2022 | 51,600 | 153,700 | 0.277 | 259,100 | 199,000 |
| Ohio | Lucas | 39095 | 2022 | 32,700 | 133,200 | 0.263 | 207,000 | 121,700 |
| Ohio | Mahoning | 39099 | 2022 | 24,400 | 69,600 | 0.251 | 204,800 | 102,000 |
| Ohio | Medina | 39103 | 2022 | 60,000 | 133,300 | 0.323 | 305,900 | 203,600 |
| Ohio | Miami | 39109 | 2022 | 46,700 | 111,900 | 0.224 | 268,500 | 225,200 |
| Ohio | Montgomery | 39113 | 2022 | 36,800 | 133,200 | 0.199 | 247,700 | 181,800 |
| Ohio | Ottawa | 39123 | 2022 | 91,200 | 198,800 | 0.309 | 355,100 | 300,400 |
| Ohio | Pickaway | 39129 | 2022 | 43,200 | 89,200 | 0.194 | 264,200 | 238,800 |
| Ohio | Portage | 39133 | 2022 | 44,500 | 80,000 | 0.265 | 263,100 | 194,500 |
| Ohio | Stark | 39151 | 2022 | 37,800 | 105,600 | 0.211 | 228,600 | 200,300 |
| Ohio | Summit | 39153 | 2022 | 42,000 | 128,700 | 0.202 | 260,500 | 217,500 |
| Ohio | Tuscarawas | 39157 | 2022 | 29,000 | 65,600 | 0.207 | 221,200 | 150,600 |
| Ohio | Union | 39159 | 2022 | 67,200 | 139,800 | 0.257 | 326,900 | 283,000 |
| Ohio | Warren | 39165 | 2022 | 59,400 | 142,300 | 0.210 | 331,200 | 316,800 |
| Ohio | Wayne | 39169 | 2022 | 33,500 | 62,100 | 0.236 | 241,000 | 164,000 |
| Ohio | Wood | 39173 | 2022 | 43,700 | 110,500 | 0.237 | 257,000 | 204,900 |
| Oklahoma | Bryan | 40013 | 2022 | 24,100 | 46,800 | 0.112 | 233,800 | 245,000 |
| Oklahoma | Canadian | 40017 | 2022 | 42,000 | 117,800 | 0.228 | 254,100 | 196,800 |
| Oklahoma | Cleveland | 40027 | 2022 | 50,500 | 175,400 | 0.249 | 275,100 | 196,300 |
| Oklahoma | Comanche | 40031 | 2022 | 28,200 | 42,700 | 0.230 | 197,100 | 182,300 |
| Oklahoma | Creek | 40037 | 2022 | 26,000 | 48,800 | 0.184 | 211,800 | 170,700 |
| Oklahoma | Delaware | 40041 | 2022 | 63,900 | 138,900 | 0.306 | 342,900 | 291,600 |
| Oklahoma | Garfield | 40047 | 2022 | 16,900 | 59,600 | 0.154 | 188,700 | 110,900 |
| Oklahoma | Grady | 40051 | 2022 | 24,000 | 45,300 | 0.162 | 221,300 | 180,300 |
| Oklahoma | Logan | 40083 | 2022 | 35,200 | 53,000 | 0.203 | 249,700 | 207,000 |
| Oklahoma | McClain | 40087 | 2022 | 36,800 | 53,300 | 0.213 | 252,500 | 227,400 |
| Oklahoma | Oklahoma | 40109 | 2022 | 46,400 | 169,400 | 0.238 | 272,400 | 191,700 |
| Oklahoma | Payne | 40119 | 2022 | 30,900 | 73,100 | 0.174 | 230,600 | 185,200 |
| Oklahoma | Pittsburg | 40121 | 2022 | 23,900 | 52,300 | 0.148 | 236,200 | 164,000 |
| Oklahoma | Pontotoc | 40123 | 2022 | 19,300 | 35,700 | 0.129 | 208,800 | 169,900 |
| Oklahoma | Rogers | 40131 | 2022 | 32,500 | 45,900 | 0.222 | 243,500 | 210,700 |
| Oklahoma | Tulsa | 40143 | 2022 | 50,900 | 193,800 | 0.249 | 257,100 | 206,500 |
| Oklahoma | Wagoner | 40145 | 2022 | 36,800 | 74,300 | 0.183 | 242,100 | 225,300 |
| Oklahoma | Washington | 40147 | 2022 | 23,400 | 82,600 | 0.195 | 194,800 | 128,500 |
| Oregon | Benton | 41003 | 2022 | 211,900 | 586,000 | 0.419 | 596,800 | 510,500 |
| Oregon | Clackamas | 41005 | 2022 | 301,200 | 855,800 | 0.428 | 718,000 | 707,800 |
| Oregon | Clatsop | 41007 | 2022 | 198,700 | 543,500 | 0.376 | 720,300 | 526,200 |
| Oregon | Columbia | 41009 | 2022 | 137,300 | 323,100 | 0.332 | 488,200 | 443,900 |
| Oregon | Crook | 41013 | 2022 | 114,900 | 182,900 | 0.294 | 496,300 | 473,400 |
| Oregon | Deschutes | 41017 | 2022 | 256,700 | 627,800 | 0.415 | 771,900 | 634,900 |
| Oregon | Douglas | 41019 | 2022 | 56,100 | 157,900 | 0.203 | 406,100 | 321,200 |
| Oregon | Hood River | 41027 | 2022 | 353,600 | 982,200 | 0.527 | 796,900 | 669,700 |
| Oregon | Jackson | 41029 | 2022 | 133,700 | 412,300 | 0.316 | 514,900 | 425,300 |
| Oregon | Josephine | 41033 | 2022 | 96,600 | 219,500 | 0.294 | 464,600 | 376,200 |
| Oregon | Klamath | 41035 | 2022 | 37,200 | 98,200 | 0.143 | 377,500 | 276,500 |
| Oregon | Lane | 41039 | 2022 | 139,200 | 460,900 | 0.314 | 566,600 | 434,700 |
| Oregon | Lincoln | 41041 | 2022 | 174,500 | 564,500 | 0.337 | 668,500 | 499,300 |
| Oregon | Linn | 41043 | 2022 | 120,200 | 346,600 | 0.307 | 456,400 | 402,800 |
| Oregon | Marion | 41047 | 2022 | 142,600 | 482,700 | 0.341 | 517,100 | 407,400 |
| Oregon | Multnomah | 41051 | 2022 | 337,200 | 1,563,600 | 0.519 | 789,900 | 565,900 |
| Oregon | Polk | 41053 | 2022 | 130,100 | 438,600 | 0.300 | 497,100 | 429,000 |
| Oregon | Tillamook | 41057 | 2022 | 200,000 | 598,800 | 0.316 | 708,700 | 624,200 |
| Oregon | Umatilla | 41059 | 2022 | 62,700 | 180,500 | 0.214 | 372,400 | 304,300 |
| Oregon | Washington | 41067 | 2022 | 313,500 | 1,300,400 | 0.446 | 702,000 | 641,600 |
| Oregon | Yamhill | 41071 | 2022 | 215,300 | 727,200 | 0.449 | 562,400 | 463,600 |
| Pennsylvania | Adams | 42001 | 2022 | 53,100 | 99,600 | 0.219 | 297,500 | 271,500 |
| Pennsylvania | Allegheny | 42003 | 2022 | 66,800 | 253,600 | 0.219 | 338,800 | 279,500 |
| Pennsylvania | Beaver | 42007 | 2022 | 31,000 | 74,100 | 0.167 | 243,600 | 203,500 |
| Pennsylvania | Berks | 42011 | 2022 | 55,600 | 157,300 | 0.216 | 281,900 | 264,300 |
| Pennsylvania | Blair | 42013 | 2022 | 22,200 | 70,200 | 0.139 | 203,800 | 175,300 |
| Pennsylvania | Bucks | 42017 | 2022 | 137,900 | 366,300 | 0.279 | 464,500 | 515,100 |
| Pennsylvania | Butler | 42019 | 2022 | 68,400 | 138,400 | 0.204 | 324,500 | 377,100 |
| Pennsylvania | Cambria | 42021 | 2022 | 18,500 | 49,400 | 0.141 | 173,400 | 148,800 |
| Pennsylvania | Carbon | 42025 | 2022 | 26,100 | 63,200 | 0.117 | 253,100 | 240,000 |
| Pennsylvania | Centre | 42027 | 2022 | 73,800 | 165,000 | 0.243 | 357,000 | 330,800 |
| Pennsylvania | Chester | 42029 | 2022 | 133,500 | 252,400 | 0.293 | 452,100 | 483,700 |
| Pennsylvania | Cumberland | 42041 | 2022 | 63,900 | 168,800 | 0.235 | 314,800 | 300,400 |
| Pennsylvania | Dauphin | 42043 | 2022 | 56,100 | 180,200 | 0.305 | 280,800 | 182,900 |
| Pennsylvania | Delaware | 42045 | 2022 | 113,000 | 473,300 | 0.281 | 406,700 | 381,200 |
| Pennsylvania | Erie | 42049 | 2022 | 25,000 | 79,400 | 0.163 | 230,000 | 171,000 |
| Pennsylvania | Franklin | 42055 | 2022 | 36,700 | 92,800 | 0.150 | 266,300 | 270,500 |
| Pennsylvania | Lackawanna | 42069 | 2022 | 27,600 | 86,800 | 0.121 | 254,100 | 247,500 |
| Pennsylvania | Lancaster | 42071 | 2022 | 77,600 | 206,900 | 0.324 | 349,000 | 256,200 |
| Pennsylvania | Lebanon | 42075 | 2022 | 55,200 | 158,700 | 0.232 | 277,100 | 259,400 |
| Pennsylvania | Lehigh | 42077 | 2022 | 74,300 | 229,300 | 0.222 | 343,000 | 322,500 |
| Pennsylvania | Luzerne | 42079 | 2022 | 24,100 | 83,000 | 0.116 | 220,300 | 200,100 |
| Pennsylvania | Lycoming | 42081 | 2022 | 35,900 | 83,300 | 0.233 | 226,800 | 173,600 |
| Pennsylvania | Monroe | 42089 | 2022 | 33,300 | 54,900 | 0.123 | 313,700 | 307,100 |
| Pennsylvania | Montgomery | 42091 | 2022 | 135,500 | 385,400 | 0.278 | 456,300 | 487,500 |
| Pennsylvania | Northampton | 42095 | 2022 | 69,400 | 188,800 | 0.226 | 339,700 | 311,800 |
| Pennsylvania | Northumberland | 42097 | 2022 | 26,900 | 74,200 | 0.167 | 196,200 | 172,800 |
| Pennsylvania | Philadelphia | 42101 | 2022 | 161,600 | 1,729,100 | 0.286 | 439,400 | 277,400 |
| Pennsylvania | Pike | 42103 | 2022 | 35,900 | 49,800 | 0.138 | 354,100 | 253,200 |
| Pennsylvania | Schuylkill | 42107 | 2022 | 24,400 | 75,900 | 0.144 | 189,100 | 170,100 |
| Pennsylvania | Washington | 42125 | 2022 | 56,200 | 139,600 | 0.274 | 266,000 | 223,200 |
| Pennsylvania | Wayne | 42127 | 2022 | 45,800 | 81,600 | 0.231 | 341,600 | 228,600 |
| Pennsylvania | Westmoreland | 42129 | 2022 | 41,100 | 93,000 | 0.210 | 248,500 | 231,100 |
| Pennsylvania | York | 42133 | 2022 | 50,900 | 127,200 | 0.220 | 276,600 | 251,300 |
| Rhode Island | Bristol | 44001 | 2022 | 213,000 | 711,700 | 0.562 | 643,100 | 397,400 |
| Rhode Island | Kent | 44003 | 2022 | 116,200 | 344,600 | 0.427 | 487,500 | 283,400 |
| Rhode Island | Newport | 44005 | 2022 | 314,500 | 781,500 | 0.610 | 831,800 | 519,500 |
| Rhode Island | Providence | 44007 | 2022 | 119,800 | 433,100 | 0.358 | 478,400 | 316,700 |
| Rhode Island | Washington | 44009 | 2022 | 267,300 | 484,700 | 0.591 | 746,900 | 470,000 |
| South Carolina | Aiken | 45003 | 2022 | 28,600 | 45,900 | 0.136 | 246,300 | 243,800 |
| South Carolina | Anderson | 45007 | 2022 | 27,700 | 49,600 | 0.127 | 271,300 | 256,800 |
| South Carolina | Beaufort | 45013 | 2022 | 110,600 | 302,500 | 0.229 | 511,200 | 564,700 |
| South Carolina | Berkeley | 45015 | 2022 | 86,700 | 212,900 | 0.234 | 384,300 | 420,100 |
| South Carolina | Charleston | 45019 | 2022 | 262,700 | 826,000 | 0.380 | 684,900 | 689,000 |
| South Carolina | Colleton | 45029 | 2022 | 24,800 | 36,400 | 0.119 | 271,800 | 294,300 |
| South Carolina | Darlington | 45031 | 2022 | 17,000 | 32,600 | 0.114 | 199,000 | 182,300 |
| South Carolina | Dorchester | 45035 | 2022 | 66,600 | 157,700 | 0.191 | 339,400 | 374,500 |
| South Carolina | Florence | 45041 | 2022 | 23,500 | 54,600 | 0.128 | 212,200 | 215,300 |
| South Carolina | Georgetown | 45043 | 2022 | 143,000 | 364,500 | 0.372 | 436,700 | 455,200 |
| South Carolina | Greenville | 45045 | 2022 | 63,200 | 177,900 | 0.184 | 355,200 | 372,400 |
| South Carolina | Horry | 45051 | 2022 | 97,600 | 270,800 | 0.268 | 394,400 | 361,200 |
| South Carolina | Kershaw | 45055 | 2022 | 44,600 | 55,600 | 0.192 | 258,700 | 258,000 |
| South Carolina | Lancaster | 45057 | 2022 | 70,600 | 158,100 | 0.172 | 331,100 | 421,200 |
| South Carolina | Laurens | 45059 | 2022 | 28,300 | 46,400 | 0.127 | 237,000 | 245,400 |
| South Carolina | Lexington | 45063 | 2022 | 37,200 | 68,600 | 0.160 | 263,300 | 281,700 |
| South Carolina | Oconee | 45073 | 2022 | 74,600 | 123,000 | 0.269 | 382,100 | 357,900 |
| South Carolina | Orangeburg | 45075 | 2022 | 25,700 | 43,600 | 0.165 | 210,700 | 183,500 |
| South Carolina | Pickens | 45077 | 2022 | 44,900 | 61,700 | 0.166 | 329,900 | 328,700 |
| South Carolina | Richland | 45079 | 2022 | 41,400 | 95,700 | 0.207 | 265,700 | 235,700 |
| South Carolina | Spartanburg | 45083 | 2022 | 33,900 | 61,300 | 0.177 | 275,400 | 213,200 |
| South Carolina | Sumter | 45085 | 2022 | 19,800 | 40,700 | 0.114 | 202,900 | 196,100 |
| South Carolina | York | 45091 | 2022 | 80,300 | 179,900 | 0.196 | 375,200 | 433,300 |
| South Dakota | Brookings | 46011 | 2022 | 45,600 | 150,300 | 0.149 | 331,800 | 315,200 |
| South Dakota | Codington | 46029 | 2022 | 45,400 | 162,600 | 0.157 | 356,300 | 289,800 |
| South Dakota | Hughes | 46065 | 2022 | 40,300 | 126,700 | 0.140 | 330,200 | 297,200 |
| South Dakota | Lawrence | 46081 | 2022 | 67,900 | 208,000 | 0.158 | 451,400 | 476,300 |
| South Dakota | Lincoln | 46083 | 2022 | 58,900 | 211,300 | 0.146 | 491,800 | 439,400 |
| South Dakota | Meade | 46093 | 2022 | 50,900 | 149,300 | 0.157 | 404,000 | 341,100 |
| South Dakota | Minnehaha | 46099 | 2022 | 64,200 | 236,400 | 0.235 | 454,900 | 276,700 |
| South Dakota | Pennington | 46103 | 2022 | 57,900 | 180,800 | 0.163 | 461,400 | 369,000 |
| Tennessee | Anderson | 47001 | 2022 | 29,900 | 58,400 | 0.143 | 325,500 | 246,100 |
| Tennessee | Blount | 47009 | 2022 | 42,800 | 80,200 | 0.162 | 390,700 | 312,500 |
| Tennessee | Bradley | 47011 | 2022 | 30,300 | 56,000 | 0.121 | 313,700 | 286,800 |
| Tennessee | Campbell | 47013 | 2022 | 34,800 | 62,700 | 0.169 | 340,500 | 258,600 |
| Tennessee | Cheatham | 47021 | 2022 | 57,100 | 65,800 | 0.188 | 389,300 | 327,700 |
| Tennessee | Coffee | 47031 | 2022 | 30,000 | 54,700 | 0.142 | 302,300 | 248,000 |
| Tennessee | Cumberland | 47035 | 2022 | 21,600 | 48,000 | 0.123 | 334,100 | 265,500 |
| Tennessee | Davidson | 47037 | 2022 | 176,900 | 495,700 | 0.364 | 577,500 | 505,000 |
| Tennessee | Dickson | 47043 | 2022 | 43,800 | 61,100 | 0.164 | 356,200 | 313,000 |
| Tennessee | Dyer | 47045 | 2022 | 16,100 | 32,500 | 0.113 | 194,700 | 161,100 |
| Tennessee | Fayette | 47047 | 2022 | 58,200 | 67,900 | 0.224 | 289,300 | 272,200 |
| Tennessee | Franklin | 47051 | 2022 | 71,400 | 105,400 | 0.259 | 342,100 | 291,300 |
| Tennessee | Gibson | 47053 | 2022 | 15,200 | 30,300 | 0.110 | 191,800 | 162,700 |
| Tennessee | Greene | 47059 | 2022 | 22,300 | 40,200 | 0.160 | 291,300 | 189,200 |
| Tennessee | Hamblen | 47063 | 2022 | 23,200 | 50,700 | 0.149 | 294,000 | 198,100 |
| Tennessee | Hamilton | 47065 | 2022 | 51,700 | 131,900 | 0.160 | 359,200 | 350,900 |
| Tennessee | Jefferson | 47089 | 2022 | 35,400 | 65,600 | 0.194 | 342,300 | 268,000 |
| Tennessee | Knox | 47093 | 2022 | 42,900 | 103,600 | 0.160 | 376,800 | 308,500 |
| Tennessee | Lawrence | 47099 | 2022 | 19,300 | 28,200 | 0.102 | 252,500 | 219,400 |
| Tennessee | Loudon | 47105 | 2022 | 50,200 | 106,900 | 0.173 | 416,300 | 351,200 |
| Tennessee | Madison | 47113 | 2022 | 23,000 | 48,100 | 0.130 | 221,600 | 192,700 |
| Tennessee | Marion | 47115 | 2022 | 27,600 | 65,300 | 0.214 | 262,400 | 234,700 |
| Tennessee | Maury | 47119 | 2022 | 59,800 | 113,400 | 0.186 | 384,400 | 336,900 |
| Tennessee | McMinn | 47107 | 2022 | 18,800 | 30,600 | 0.104 | 260,600 | 211,000 |
| Tennessee | Monroe | 47123 | 2022 | 26,100 | 36,100 | 0.116 | 319,100 | 256,400 |
| Tennessee | Montgomery | 47125 | 2022 | 44,900 | 98,000 | 0.183 | 324,000 | 263,400 |
| Tennessee | Putnam | 47141 | 2022 | 34,300 | 57,000 | 0.143 | 325,000 | 262,600 |
| Tennessee | Rhea | 47143 | 2022 | 33,700 | 57,100 | 0.157 | 308,900 | 266,700 |
| Tennessee | Roane | 47145 | 2022 | 34,400 | 74,900 | 0.204 | 298,800 | 266,700 |
| Tennessee | Robertson | 47147 | 2022 | 61,500 | 94,200 | 0.209 | 366,500 | 321,900 |
| Tennessee | Rutherford | 47149 | 2022 | 80,700 | 132,100 | 0.264 | 408,100 | 367,500 |
| Tennessee | Sevier | 47155 | 2022 | 58,100 | 86,000 | 0.123 | 592,100 | 498,200 |
| Tennessee | Shelby | 47157 | 2022 | 45,600 | 169,600 | 0.183 | 253,400 | 254,600 |
| Tennessee | Sullivan | 47163 | 2022 | 23,800 | 54,400 | 0.145 | 289,300 | 204,600 |
| Tennessee | Sumner | 47165 | 2022 | 93,300 | 176,200 | 0.252 | 426,100 | 418,000 |
| Tennessee | Tipton | 47167 | 2022 | 34,900 | 51,000 | 0.168 | 248,500 | 222,000 |
| Tennessee | Washington | 47179 | 2022 | 31,200 | 68,300 | 0.162 | 327,000 | 243,800 |
| Tennessee | Williamson | 47187 | 2022 | 210,700 | 476,500 | 0.299 | 624,200 | 815,900 |
| Tennessee | Wilson | 47189 | 2022 | 99,100 | 183,900 | 0.257 | 430,200 | 425,100 |
| Texas | Angelina | 48005 | 2022 | 20,500 | 38,600 | 0.122 | 221,300 | 193,700 |
| Texas | Aransas | 48007 | 2022 | 122,800 | 348,700 | 0.320 | 522,400 | 383,700 |
| Texas | Bastrop | 48021 | 2022 | 73,000 | 142,600 | 0.269 | 378,600 | 368,200 |
| Texas | Bell | 48027 | 2022 | 35,500 | 122,100 | 0.141 | 271,500 | 267,600 |
| Texas | Bexar | 48029 | 2022 | 67,600 | 272,900 | 0.230 | 328,200 | 277,200 |
| Texas | Bowie | 48037 | 2022 | 17,400 | 39,200 | 0.125 | 191,700 | 166,000 |
| Texas | Brazoria | 48039 | 2022 | 51,900 | 140,600 | 0.174 | 294,200 | 307,500 |
| Texas | Brazos | 48041 | 2022 | 79,500 | 237,400 | 0.289 | 323,500 | 284,500 |
| Texas | Burnet | 48053 | 2022 | 114,600 | 257,700 | 0.303 | 489,600 | 453,700 |
| Texas | Cameron | 48061 | 2022 | 51,000 | 162,000 | 0.230 | 240,400 | 211,900 |
| Texas | Chambers | 48071 | 2022 | 39,100 | 86,800 | 0.159 | 268,700 | 329,300 |
| Texas | Cherokee | 48073 | 2022 | 23,600 | 46,200 | 0.154 | 209,400 | 186,500 |
| Texas | Collin | 48085 | 2022 | 153,000 | 342,900 | 0.303 | 431,400 | 563,800 |
| Texas | Comal | 48091 | 2022 | 90,200 | 195,200 | 0.247 | 425,700 | 451,200 |
| Texas | Cooke | 48097 | 2022 | 54,500 | 141,200 | 0.225 | 312,300 | 312,300 |
| Texas | Coryell | 48099 | 2022 | 26,100 | 65,100 | 0.154 | 251,000 | 186,900 |
| Texas | Dallas | 48113 | 2022 | 161,800 | 680,700 | 0.409 | 423,000 | 374,200 |
| Texas | Denton | 48121 | 2022 | 136,700 | 495,100 | 0.292 | 428,000 | 450,000 |
| Texas | Ector | 48135 | 2022 | 41,200 | 134,100 | 0.229 | 248,200 | 182,000 |
| Texas | El Paso | 48141 | 2022 | 47,800 | 203,700 | 0.228 | 255,100 | 178,900 |
| Texas | Ellis | 48139 | 2022 | 59,600 | 119,300 | 0.220 | 323,400 | 311,200 |
| Texas | Fort Bend | 48157 | 2022 | 81,300 | 293,600 | 0.210 | 325,700 | 377,300 |
| Texas | Galveston | 48167 | 2022 | 82,800 | 279,600 | 0.205 | 382,900 | 376,500 |
| Texas | Grayson | 48181 | 2022 | 53,700 | 137,100 | 0.228 | 302,300 | 273,600 |
| Texas | Gregg | 48183 | 2022 | 24,300 | 64,400 | 0.141 | 233,000 | 196,200 |
| Texas | Guadalupe | 48187 | 2022 | 59,700 | 158,800 | 0.215 | 334,200 | 319,700 |
| Texas | Hardin | 48199 | 2022 | 35,500 | 65,200 | 0.181 | 240,600 | 246,200 |
| Texas | Harris | 48201 | 2022 | 126,500 | 507,300 | 0.332 | 350,500 | 315,600 |
| Texas | Harrison | 48203 | 2022 | 23,700 | 43,500 | 0.140 | 213,200 | 195,900 |
| Texas | Hays | 48209 | 2022 | 110,900 | 216,700 | 0.273 | 470,200 | 520,700 |
| Texas | Henderson | 48213 | 2022 | 114,000 | 148,400 | 0.384 | 404,600 | 325,300 |
| Texas | Hidalgo | 48215 | 2022 | 54,300 | 183,700 | 0.274 | 218,800 | 193,600 |
| Texas | Hood | 48221 | 2022 | 67,500 | 90,800 | 0.251 | 391,500 | 369,000 |
| Texas | Hunt | 48231 | 2022 | 43,900 | 87,700 | 0.214 | 262,900 | 236,600 |
| Texas | Jefferson | 48245 | 2022 | 27,500 | 96,200 | 0.176 | 213,900 | 165,200 |
| Texas | Johnson | 48251 | 2022 | 58,100 | 102,200 | 0.253 | 312,600 | 288,500 |
| Texas | Kaufman | 48257 | 2022 | 62,000 | 119,900 | 0.234 | 303,100 | 305,800 |
| Texas | Kendall | 48259 | 2022 | 100,300 | 240,400 | 0.243 | 441,700 | 491,300 |
| Texas | Kerr | 48265 | 2022 | 55,200 | 103,700 | 0.211 | 370,400 | 355,100 |
| Texas | Llano | 48299 | 2022 | 176,600 | 362,300 | 0.283 | 658,000 | 693,200 |
| Texas | Lubbock | 48303 | 2022 | 35,600 | 131,800 | 0.145 | 253,600 | 240,400 |
| Texas | Maverick | 48323 | 2022 | 49,200 | 175,400 | 0.242 | 236,100 | 201,200 |
| Texas | McLennan | 48309 | 2022 | 36,700 | 103,500 | 0.168 | 300,200 | 233,800 |
| Texas | Medina | 48325 | 2022 | 50,100 | 87,000 | 0.217 | 277,000 | 285,200 |
| Texas | Midland | 48329 | 2022 | 56,400 | 180,200 | 0.175 | 311,900 | 327,700 |
| Texas | Montgomery | 48339 | 2022 | 75,900 | 188,100 | 0.247 | 319,900 | 351,000 |
| Texas | Nueces | 48355 | 2022 | 51,800 | 197,900 | 0.221 | 300,100 | 211,900 |
| Texas | Orange | 48361 | 2022 | 22,700 | 49,000 | 0.165 | 208,000 | 168,800 |
| Texas | Parker | 48367 | 2022 | 60,900 | 83,200 | 0.220 | 345,700 | 362,200 |
| Texas | Potter | 48375 | 2022 | 19,900 | 78,000 | 0.122 | 227,500 | 163,500 |
| Texas | Randall | 48381 | 2022 | 28,000 | 91,400 | 0.111 | 273,200 | 252,100 |
| Texas | Rockwall | 48397 | 2022 | 124,600 | 335,600 | 0.312 | 383,600 | 423,100 |
| Texas | San Patricio | 48409 | 2022 | 37,700 | 113,000 | 0.233 | 277,600 | 167,800 |
| Texas | Smith | 48423 | 2022 | 42,400 | 88,900 | 0.163 | 286,800 | 294,800 |
| Texas | Tarrant | 48439 | 2022 | 98,400 | 391,100 | 0.251 | 373,600 | 380,900 |
| Texas | Taylor | 48441 | 2022 | 29,700 | 103,000 | 0.177 | 239,900 | 173,200 |
| Texas | Travis | 48453 | 2022 | 370,000 | 1,300,600 | 0.482 | 786,600 | 763,300 |
| Texas | Val Verde | 48465 | 2022 | 30,300 | 101,900 | 0.184 | 220,300 | 166,400 |
| Texas | Victoria | 48469 | 2022 | 28,700 | 81,100 | 0.137 | 246,100 | 218,700 |
| Texas | Walker | 48471 | 2022 | 32,400 | 62,300 | 0.184 | 265,700 | 264,900 |
| Texas | Waller | 48473 | 2022 | 54,400 | 111,900 | 0.242 | 276,200 | 300,600 |
| Texas | Washington | 48477 | 2022 | 51,600 | 103,400 | 0.190 | 321,300 | 314,100 |
| Texas | Webb | 48479 | 2022 | 81,800 | 335,500 | 0.285 | 267,300 | 196,800 |
| Texas | Wichita | 48485 | 2022 | 30,800 | 112,000 | 0.209 | 225,400 | 145,900 |
| Texas | Williamson | 48491 | 2022 | 143,500 | 462,500 | 0.270 | 497,400 | 532,100 |
| Texas | Wilson | 48493 | 2022 | 44,900 | 67,500 | 0.197 | 314,900 | 317,800 |
| Texas | Wise | 48497 | 2022 | 57,200 | 96,800 | 0.244 | 324,100 | 300,700 |
| Texas | Wood | 48499 | 2022 | 33,200 | 56,500 | 0.163 | 268,200 | 239,700 |
| Utah | Box Elder | 49003 | 2022 | 113,200 | 271,900 | 0.250 | 468,200 | 526,500 |
| Utah | Cache | 49005 | 2022 | 128,700 | 358,300 | 0.250 | 531,100 | 538,300 |
| Utah | Davis | 49011 | 2022 | 200,500 | 690,600 | 0.322 | 648,300 | 635,300 |
| Utah | Iron | 49021 | 2022 | 92,500 | 264,900 | 0.194 | 500,200 | 490,400 |
| Utah | Morgan | 49029 | 2022 | 197,100 | 433,200 | 0.242 | 665,100 | 920,800 |
| Utah | Salt Lake | 49035 | 2022 | 281,900 | 1,125,400 | 0.473 | 787,000 | 565,400 |
| Utah | Summit | 49043 | 2022 | 785,200 | 1,722,900 | 0.458 | 1,578,800 | 1,732,900 |
| Utah | Tooele | 49045 | 2022 | 140,400 | 451,600 | 0.296 | 528,400 | 482,200 |
| Utah | Uintah | 49047 | 2022 | 42,000 | 109,100 | 0.139 | 321,200 | 330,100 |
| Utah | Utah | 49049 | 2022 | 234,200 | 811,100 | 0.447 | 682,900 | 521,100 |
| Utah | Wasatch | 49051 | 2022 | 331,600 | 833,800 | 0.311 | 908,800 | 1,091,100 |
| Utah | Washington | 49053 | 2022 | 225,000 | 683,100 | 0.395 | 609,800 | 592,500 |
| Utah | Weber | 49057 | 2022 | 155,200 | 489,500 | 0.354 | 592,700 | 454,100 |
| Vermont | Chittenden | 50007 | 2022 | 131,900 | 360,000 | 0.266 | 571,500 | 506,600 |
| Vermont | Franklin | 50011 | 2022 | 58,800 | 107,500 | 0.198 | 323,200 | 329,700 |
| Virginia | Accomack | 51001 | 2022 | 61,100 | 129,400 | 0.198 | 331,200 | 310,200 |
| Virginia | Albemarle | 51003 | 2022 | 138,200 | 233,600 | 0.337 | 492,800 | 462,400 |
| Virginia | Alexandria City | 51510 | 2022 | 690,900 | 4,851,300 | 0.601 | 1,266,300 | 863,400 |
| Virginia | Arlington | 51013 | 2022 | 773,700 | 4,193,800 | 0.729 | 1,232,600 | 956,900 |
| Virginia | Bedford | 51019 | 2022 | 61,700 | 80,900 | 0.239 | 383,400 | 308,400 |
| Virginia | Botetourt | 51023 | 2022 | 47,600 | 61,600 | 0.216 | 313,500 | 262,100 |
| Virginia | Campbell | 51031 | 2022 | 30,300 | 47,500 | 0.166 | 277,400 | 206,800 |
| Virginia | Caroline | 51033 | 2022 | 62,800 | 88,400 | 0.206 | 346,300 | 313,700 |
| Virginia | Chesapeake City | 51550 | 2022 | 113,800 | 380,300 | 0.385 | 361,700 | 295,500 |
| Virginia | Chesterfield | 51041 | 2022 | 65,200 | 147,400 | 0.188 | 343,300 | 373,900 |
| Virginia | Culpeper | 51047 | 2022 | 75,100 | 121,100 | 0.251 | 384,500 | 327,900 |
| Virginia | Fairfax | 51059 | 2022 | 356,200 | 1,227,700 | 0.427 | 844,500 | 806,300 |
| Virginia | Fauquier | 51061 | 2022 | 133,800 | 199,300 | 0.318 | 496,600 | 463,300 |
| Virginia | Franklin | 51067 | 2022 | 114,300 | 136,000 | 0.332 | 503,300 | 367,200 |
| Virginia | Frederick | 51069 | 2022 | 72,500 | 168,600 | 0.217 | 392,500 | 345,400 |
| Virginia | Gloucester | 51073 | 2022 | 61,000 | 87,800 | 0.221 | 344,200 | 319,700 |
| Virginia | Hampton City | 51650 | 2022 | 75,400 | 305,800 | 0.293 | 319,200 | 241,900 |
| Virginia | Hanover | 51085 | 2022 | 82,300 | 145,700 | 0.232 | 353,800 | 379,900 |
| Virginia | Henrico | 51087 | 2022 | 82,400 | 234,200 | 0.236 | 393,300 | 362,800 |
| Virginia | Isle of Wight | 51093 | 2022 | 77,300 | 114,000 | 0.236 | 317,800 | 369,100 |
| Virginia | James City | 51095 | 2022 | 92,600 | 230,100 | 0.240 | 367,100 | 412,200 |
| Virginia | Loudoun | 51107 | 2022 | 261,000 | 1,050,300 | 0.362 | 709,200 | 652,200 |
| Virginia | Louisa | 51109 | 2022 | 160,300 | 104,100 | 0.329 | 538,300 | 379,100 |
| Virginia | Lynchburg City | 51680 | 2022 | 30,000 | 87,300 | 0.129 | 276,100 | 240,400 |
| Virginia | Manassas City | 51683 | 2022 | 159,000 | 705,400 | 0.345 | 545,300 | 414,800 |
| Virginia | Montgomery | 51121 | 2022 | 57,200 | 107,400 | 0.179 | 361,700 | 347,100 |
| Virginia | Newport News City | 51700 | 2022 | 76,800 | 308,400 | 0.268 | 318,400 | 271,400 |
| Virginia | Norfolk City | 51710 | 2022 | 123,500 | 520,100 | 0.321 | 382,300 | 336,600 |
| Virginia | Orange | 51137 | 2022 | 63,200 | 85,300 | 0.244 | 349,100 | 310,100 |
| Virginia | Pittsylvania | 51143 | 2022 | 19,000 | 31,600 | 0.123 | 253,400 | 215,000 |
| Virginia | Portsmouth City | 51740 | 2022 | 72,800 | 264,200 | 0.292 | 312,700 | 244,100 |
| Virginia | Prince William | 51153 | 2022 | 177,200 | 600,200 | 0.365 | 568,800 | 455,000 |
| Virginia | Richmond City | 51760 | 2022 | 97,700 | 402,400 | 0.245 | 477,100 | 371,200 |
| Virginia | Roanoke City | 51770 | 2022 | 31,100 | 117,800 | 0.180 | 299,200 | 175,500 |
| Virginia | Roanoke | 51161 | 2022 | 49,300 | 95,400 | 0.195 | 341,900 | 278,200 |
| Virginia | Rockingham | 51165 | 2022 | 55,200 | 121,100 | 0.174 | 350,600 | 348,900 |
| Virginia | Spotsylvania | 51177 | 2022 | 95,600 | 184,300 | 0.273 | 418,800 | 375,400 |
| Virginia | Stafford | 51179 | 2022 | 110,400 | 260,200 | 0.279 | 454,400 | 401,500 |
| Virginia | Suffolk City | 51800 | 2022 | 77,800 | 191,000 | 0.266 | 312,700 | 323,100 |
| Virginia | Virginia Beach City | 51810 | 2022 | 180,500 | 680,600 | 0.431 | 442,800 | 408,200 |
| Virginia | Westmoreland | 51193 | 2022 | 61,500 | 134,800 | 0.191 | 397,900 | 338,700 |
| Virginia | York | 51199 | 2022 | 115,300 | 293,700 | 0.300 | 364,500 | 421,500 |
| Washington | Benton | 53005 | 2022 | 110,300 | 314,000 | 0.290 | 460,800 | 401,300 |
| Washington | Chelan | 53007 | 2022 | 195,300 | 466,400 | 0.341 | 695,200 | 628,900 |
| Washington | Clallam | 53009 | 2022 | 87,200 | 201,500 | 0.195 | 524,200 | 492,400 |
| Washington | Clark | 53011 | 2022 | 210,900 | 705,400 | 0.399 | 617,200 | 515,100 |
| Washington | Cowlitz | 53015 | 2022 | 85,800 | 173,800 | 0.236 | 466,700 | 400,800 |
| Washington | Douglas | 53017 | 2022 | 136,000 | 391,600 | 0.312 | 561,300 | 473,200 |
| Washington | Franklin | 53021 | 2022 | 103,700 | 323,700 | 0.286 | 435,300 | 384,400 |
| Washington | Grant | 53025 | 2022 | 72,300 | 191,100 | 0.206 | 419,200 | 370,600 |
| Washington | Grays Harbor | 53027 | 2022 | 62,700 | 180,700 | 0.190 | 422,300 | 341,100 |
| Washington | Island | 53029 | 2022 | 234,000 | 410,600 | 0.365 | 799,400 | 737,000 |
| Washington | Jefferson | 53031 | 2022 | 193,800 | 438,400 | 0.328 | 743,800 | 624,600 |
| Washington | King | 53033 | 2022 | 598,300 | 2,194,300 | 0.550 | 1,292,200 | 1,028,700 |
| Washington | Kitsap | 53035 | 2022 | 167,600 | 410,400 | 0.318 | 699,300 | 582,900 |
| Washington | Kittitas | 53037 | 2022 | 168,800 | 427,500 | 0.338 | 605,300 | 523,800 |
| Washington | Lewis | 53041 | 2022 | 70,900 | 147,600 | 0.195 | 444,100 | 394,500 |
| Washington | Mason | 53045 | 2022 | 118,500 | 236,300 | 0.277 | 576,700 | 490,900 |
| Washington | Pacific | 53049 | 2022 | 84,800 | 224,000 | 0.251 | 461,600 | 365,700 |
| Washington | Pierce | 53053 | 2022 | 230,300 | 679,800 | 0.418 | 648,600 | 557,400 |
| Washington | Skagit | 53057 | 2022 | 181,100 | 489,200 | 0.332 | 641,100 | 569,400 |
| Washington | Snohomish | 53061 | 2022 | 369,100 | 1,152,100 | 0.486 | 879,500 | 757,500 |
| Washington | Spokane | 53063 | 2022 | 106,200 | 367,000 | 0.287 | 539,000 | 368,100 |
| Washington | Stevens | 53065 | 2022 | 99,400 | 183,900 | 0.270 | 478,000 | 391,700 |
| Washington | Thurston | 53067 | 2022 | 129,200 | 339,700 | 0.279 | 557,100 | 489,600 |
| Washington | Walla Walla | 53071 | 2022 | 104,500 | 299,000 | 0.291 | 497,800 | 383,900 |
| Washington | Whatcom | 53073 | 2022 | 253,000 | 718,700 | 0.407 | 751,000 | 624,800 |
| Washington | Whitman | 53075 | 2022 | 83,600 | 255,200 | 0.221 | 445,700 | 384,500 |
| Washington | Yakima | 53077 | 2022 | 66,100 | 167,000 | 0.219 | 399,300 | 312,000 |
| West Virginia | Berkeley | 54003 | 2022 | 46,500 | 95,200 | 0.178 | 294,500 | 287,600 |
| West Virginia | Cabell | 54011 | 2022 | 35,800 | 108,800 | 0.206 | 213,800 | 172,800 |
| West Virginia | Harrison | 54033 | 2022 | 28,500 | 57,500 | 0.161 | 229,500 | 210,900 |
| West Virginia | Jefferson | 54037 | 2022 | 58,000 | 85,500 | 0.203 | 334,600 | 355,300 |
| West Virginia | Kanawha | 54039 | 2022 | 29,300 | 75,500 | 0.177 | 220,800 | 180,900 |
| West Virginia | Marion | 54049 | 2022 | 27,500 | 49,700 | 0.175 | 209,800 | 183,600 |
| West Virginia | Mercer | 54055 | 2022 | 16,700 | 30,200 | 0.135 | 198,400 | 167,300 |
| West Virginia | Monongalia | 54061 | 2022 | 58,900 | 111,300 | 0.220 | 331,900 | 314,600 |
| West Virginia | Putnam | 54079 | 2022 | 38,700 | 76,300 | 0.184 | 253,500 | 252,100 |
| West Virginia | Raleigh | 54081 | 2022 | 18,200 | 46,900 | 0.146 | 200,700 | 162,500 |
| West Virginia | Wood | 54107 | 2022 | 26,600 | 77,500 | 0.174 | 221,100 | 164,400 |
| Wisconsin | Adams | 55001 | 2022 | 61,500 | 82,500 | 0.198 | 342,700 | 305,400 |
| Wisconsin | Brown | 55009 | 2022 | 43,600 | 127,400 | 0.159 | 333,000 | 312,500 |
| Wisconsin | Calumet | 55015 | 2022 | 42,900 | 155,300 | 0.169 | 330,400 | 250,900 |
| Wisconsin | Chippewa | 55017 | 2022 | 49,300 | 101,200 | 0.187 | 298,500 | 335,300 |
| Wisconsin | Dane | 55025 | 2022 | 171,100 | 687,600 | 0.499 | 549,300 | 314,800 |
| Wisconsin | Eau Claire | 55035 | 2022 | 44,000 | 150,700 | 0.214 | 331,100 | 210,200 |
| Wisconsin | Grant | 55043 | 2022 | 24,000 | 52,700 | 0.126 | 216,200 | 210,900 |
| Wisconsin | Jefferson | 55055 | 2022 | 58,800 | 151,300 | 0.196 | 329,700 | 334,900 |
| Wisconsin | Kenosha | 55059 | 2022 | 68,700 | 221,400 | 0.270 | 353,700 | 270,100 |
| Wisconsin | La Crosse | 55063 | 2022 | 47,400 | 145,800 | 0.158 | 334,000 | 309,000 |
| Wisconsin | Marathon | 55073 | 2022 | 32,500 | 65,500 | 0.149 | 257,500 | 251,100 |
| Wisconsin | Marinette | 55075 | 2022 | 24,200 | 50,400 | 0.159 | 215,800 | 187,400 |
| Wisconsin | Milwaukee | 55079 | 2022 | 47,100 | 238,900 | 0.226 | 306,600 | 174,300 |
| Wisconsin | Monroe | 55081 | 2022 | 18,800 | 40,600 | 0.098 | 222,800 | 207,100 |
| Wisconsin | Oconto | 55083 | 2022 | 63,900 | 77,500 | 0.221 | 287,000 | 289,100 |
| Wisconsin | Outagamie | 55087 | 2022 | 36,700 | 151,800 | 0.145 | 326,800 | 246,900 |
| Wisconsin | Ozaukee | 55089 | 2022 | 94,200 | 177,100 | 0.236 | 414,500 | 488,300 |
| Wisconsin | Portage | 55097 | 2022 | 32,100 | 77,200 | 0.158 | 277,900 | 264,600 |
| Wisconsin | Racine | 55101 | 2022 | 59,600 | 196,500 | 0.228 | 333,500 | 292,700 |
| Wisconsin | Rock | 55105 | 2022 | 36,000 | 132,300 | 0.200 | 304,000 | 181,700 |
| Wisconsin | Sauk | 55111 | 2022 | 55,300 | 112,000 | 0.187 | 320,200 | 316,800 |
| Wisconsin | St. Croix | 55109 | 2022 | 52,900 | 107,500 | 0.161 | 367,100 | 382,700 |
| Wisconsin | Vilas | 55125 | 2022 | 192,900 | 247,300 | 0.520 | 508,500 | 505,500 |
| Wisconsin | Walworth | 55127 | 2022 | 64,700 | 165,300 | 0.174 | 468,800 | 452,600 |
| Wisconsin | Washington | 55131 | 2022 | 52,300 | 181,500 | 0.214 | 363,400 | 249,400 |
| Wisconsin | Waukesha | 55133 | 2022 | 101,600 | 246,500 | 0.329 | 440,100 | 352,200 |
| Wisconsin | Winnebago | 55139 | 2022 | 45,700 | 182,400 | 0.218 | 294,200 | 203,100 |
| Wisconsin | Wood | 55141 | 2022 | 22,200 | 53,700 | 0.132 | 221,700 | 192,300 |
| Wyoming | Albany | 56001 | 2022 | 73,100 | 306,600 | 0.186 | 437,900 | 346,100 |
| Wyoming | Fremont | 56013 | 2022 | 52,500 | 143,200 | 0.172 | 362,500 | 327,300 |
| Wyoming | Laramie | 56021 | 2022 | 65,100 | 264,900 | 0.219 | 467,800 | 276,600 |
| Wyoming | Natrona | 56025 | 2022 | 57,300 | 212,500 | 0.178 | 381,700 | 306,400 |
| Wyoming | Sheridan | 56033 | 2022 | 82,500 | 256,700 | 0.201 | 461,100 | 420,600 |
| Wyoming | Sweetwater | 56037 | 2022 | 82,900 | 343,600 | 0.237 | 375,300 | 302,600 |
Appendix 2: 中国房地产状况 (The Real Estate Landscape in China)
产权: 中国购房者拥有的是「房屋所有权」和「土地使用权」(住宅通常为70年),而美国是永久产权。这使得中国的土地价值在理论上是有期限的「租用」价值。
Property Rights: In China, homebuyers purchase “Building Ownership” and “Land Use Rights” (typically 70 years for residential property), whereas in the U.S., it involves permanent, fee-simple ownership. This means the land value in China is theoretically a time-limited “leasehold” value.
物业形态: 美国数据主要针对独栋住宅,其土地和建筑物可以相对分离地评估。中国的公寓楼,土地是整栋楼业主共同共有,无法物理分割。
Property Type: U.S. data primarily focuses on single-family homes, where the land and the structure can be assessed relatively separately. In China, for apartment buildings, the land is collectively owned by all owners of the building and cannot be physically subdivided.
驱动因素: 在中国,土地价值的背后捆绑了户籍、教育、医疗等巨大的公共资源,这在一二线城市尤其明显,导致地价成为房价的核心驱动力。
Driving Factors: In China, land value is intensely bundled with access to significant public resources such as household registration (hukou), education, and healthcare. This is particularly evident in first- and second-tier cities, making land cost a core driver of housing prices.
2009年7月23日,国土资源部(现已成为「自然资源部」)下属的中国土地勘测规划院网站公布了全国620个调查项目的地价房价比调查数据。尽管数据年代久远,科学性和准确性尚存争议,但不失为有用的历史数据。
On July 23, 2009, the website of the China Land Surveying and Planning Institute (under the former Ministry of Land and Resources, now part of the “Ministry of Natural Resources”) published the land-price-to-housing-price ratio data from a national survey of 620 projects. Although this data is dated, and its scientific rigor and accuracy remain debated, it still serves as useful historical data.
| 地区 Area |
项目调查最值 Survey Type |
楼面地价 Land Price (RMB/m²) |
开盘均价 Sale Price (RMB/m²) |
地价房价比例 Land/Price Ratio (%) |
|---|---|---|---|---|
| 北京 Beijing | 最低值 Min | 1,333 | 7,400 | 14.33 |
| 北京 Beijing | 最高值 Max | 8,218 | 45,000 | 51.36 |
| 上海 Shanghai | 最低值 Min | 1,165 | 7,669 | 15.19 |
| 上海 Shanghai | 最高值 Max | 6,677 | 23,139 | 31.95 |
| 天津 Tianjin | 最低值 Min | 1,034 | 4,848 | 14.01 |
| 天津 Tianjin | 最高值 Max | 3,791 | 10,107 | 49.00 |
| 重庆 Chongqing | 最低值 Min | 127 | 1,130 | 5.29 |
| 重庆 Chongqing | 最高值 Max | 2,746 | 7,253 | 45.77 |
| 合肥 Hefei | 最低值 Min | 588 | 3,680 | 15.60 |
| 合肥 Hefei | 最高值 Max | 1,454 | 6,600 | 31.36 |
| 福州 Fuzhou | 最低值 Min | 1,961 | 6,500 | 29.71 |
| 福州 Fuzhou | 最高值 Max | 3,927 | 8,500 | 47.72 |
| 厦门 Xiamen | 最低值 Min | 1,150 | 6,061 | 17.44 |
| 厦门 Xiamen | 最高值 Max | 7,326 | 13,230 | 57.22 |
| 兰州 Lanzhou | 最低值 Min | 612 | 3,270 | 16.40 |
| 兰州 Lanzhou | 最高值 Max | 834 | 3,731 | 25.50 |
| 深圳 Shenzhen | 最低值 Min | 1,761 | 4,830 | 21.88 |
| 深圳 Shenzhen | 最高值 Max | 4,555 | 17,283 | 47.95 |
| 广州 Guangzhou | 最低值 Min | 3,974 | 9,500 | 22.83 |
| 广州 Guangzhou | 最高值 Max | 4,566 | 20,000 | 42.45 |
| 南宁 Nanning | 最低值 Min | 493 | 3,700 | 12.07 |
| 南宁 Nanning | 最高值 Max | 1,865 | 7,200 | 39.68 |
| 北海 Beihai | 最低值 Min | 229 | 2,200 | 8.81 |
| 北海 Beihai | 最高值 Max | 458 | 2,600 | 19.91 |
| 贵阳 Guiyang | 最低值 Min | 970 | 4,500 | 21.56 |
| 贵阳 Guiyang | 最高值 Max | 1,650 | 4,500 | 36.67 |
| 海口 Haikou | 最低值 Min | 361 | 2,920 | 8.80 |
| 海口 Haikou | 最高值 Max | 1,583 | 8,600 | 24.59 |
| 石家庄 Shijiazhuang | 最低值 Min | 452 | 2,600 | 17.38 |
| 石家庄 Shijiazhuang | 最高值 Max | 3,869 | 6,600 | 58.62 |
| 郑州 Zhengzhou | 最低值 Min | 932 | 4,300 | 18.96 |
| 郑州 Zhengzhou | 最高值 Max | 1,441 | 5,100 | 32.02 |
| 哈尔滨 Harbin | - | 1,013 | 5,000 | 20.26 |
| 武汉 Wuhan | 最低值 Min | 477 | 3,800 | 12.55 |
| 武汉 Wuhan | 最高值 Max | 2,809 | 10,130 | 40.92 |
| 长沙 Changsha | 最低值 Min | 486 | 3,800 | 12.79 |
| 长沙 Changsha | 最高值 Max | 2,040 | 9,600 | 27.24 |
| 长春 Changchun | 最低值 Min | 296 | 1,850 | 8.84 |
| 长春 Changchun | 最高值 Max | 1,846 | 10,000 | 24.89 |
| 南京 Nanjing | 最低值 Min | 701 | 3,300 | 20.12 |
| 南京 Nanjing | 最高值 Max | 6,026 | 16,000 | 46.35 |
| 南昌 Nanchang | 最低值 Min | 333 | 2,900 | 11.49 |
| 南昌 Nanchang | 最高值 Max | 2,461 | 7,000 | 38.05 |
| 昆明 Kunming | 最低值 Min | 794 | 4,100 | 19.36 |
| 昆明 Kunming | 最高值 Max | 1,898 | 6,400 | 29.66 |
| 沈阳 Shenyang | 最低值 Min | 440 | 2,850 | 15.44 |
| 沈阳 Shenyang | 最高值 Max | 1,274 | 5,600 | 27.11 |
| 呼和浩特 Hohhot | 最低值 Min | 296 | 1,900 | 9.89 |
| 呼和浩特 Hohhot | 最高值 Max | 1,056 | 4,600 | 29.33 |
| 银川 Yinchuan | 最低值 Min | 450 | 3,413 | 13.18 |
| 银川 Yinchuan | 最高值 Max | 750 | 3,900 | 19.23 |
| 济南 Jinan | 最低值 Min | 719 | 3,200 | 14.52 |
| 济南 Jinan | 最高值 Max | 2,710 | 8,000 | 33.88 |
| 太原 Taiyuan | 最低值 Min | 467 | 4,400 | 10.61 |
| 太原 Taiyuan | 最高值 Max | 1,933 | 7,500 | 25.77 |
| 西安 Xi’an | 最低值 Min | 512 | 4,200 | 11.38 |
| 西安 Xi’an | 最高值 Max | 1,008 | 5,800 | 18.51 |
| 成都 Chengdu | 最低值 Min | 642 | 4,200 | 14.76 |
| 成都 Chengdu | 最高值 Max | 2,536 | 7,200 | 35.22 |
| 拉萨 Lhasa | 最低值 Min | 381 | 2,280 | 10.60 |
| 拉萨 Lhasa | 最高值 Max | 1,074 | 4,600 | 47.12 |
| 西宁 Xining | 最低值 Min | 314 | 2,800 | 8.65 |
| 西宁 Xining | 最高值 Max | 352 | 3,700 | 12.57 |
| 乌鲁木齐 Ürümqi | 最低值 Min | 219.55 | 2,200 | 8.54 |
| 乌鲁木齐 Ürümqi | 最高值 Max | 899.39 | 4,500 | 32.35 |
| 杭州 Hangzhou | 最低值 Min | 2,411 | 7,100 | 32.67 |
| 杭州 Hangzhou | 最高值 Max | 6,864 | 15,560 | 50.81 |
| 宁波 Ningbo | 最低值 Min | 2,045 | 6,825 | 11.39 |
| 宁波 Ningbo | 最高值 Max | 4,755 | 20,160 | 34.06 |
| 温州 Wenzhou | 最低值 Min | 3,325 | 11,080 | 28.04 |
| 温州 Wenzhou | 最高值 Max | 7,564 | 26,980 | 45.78 |